
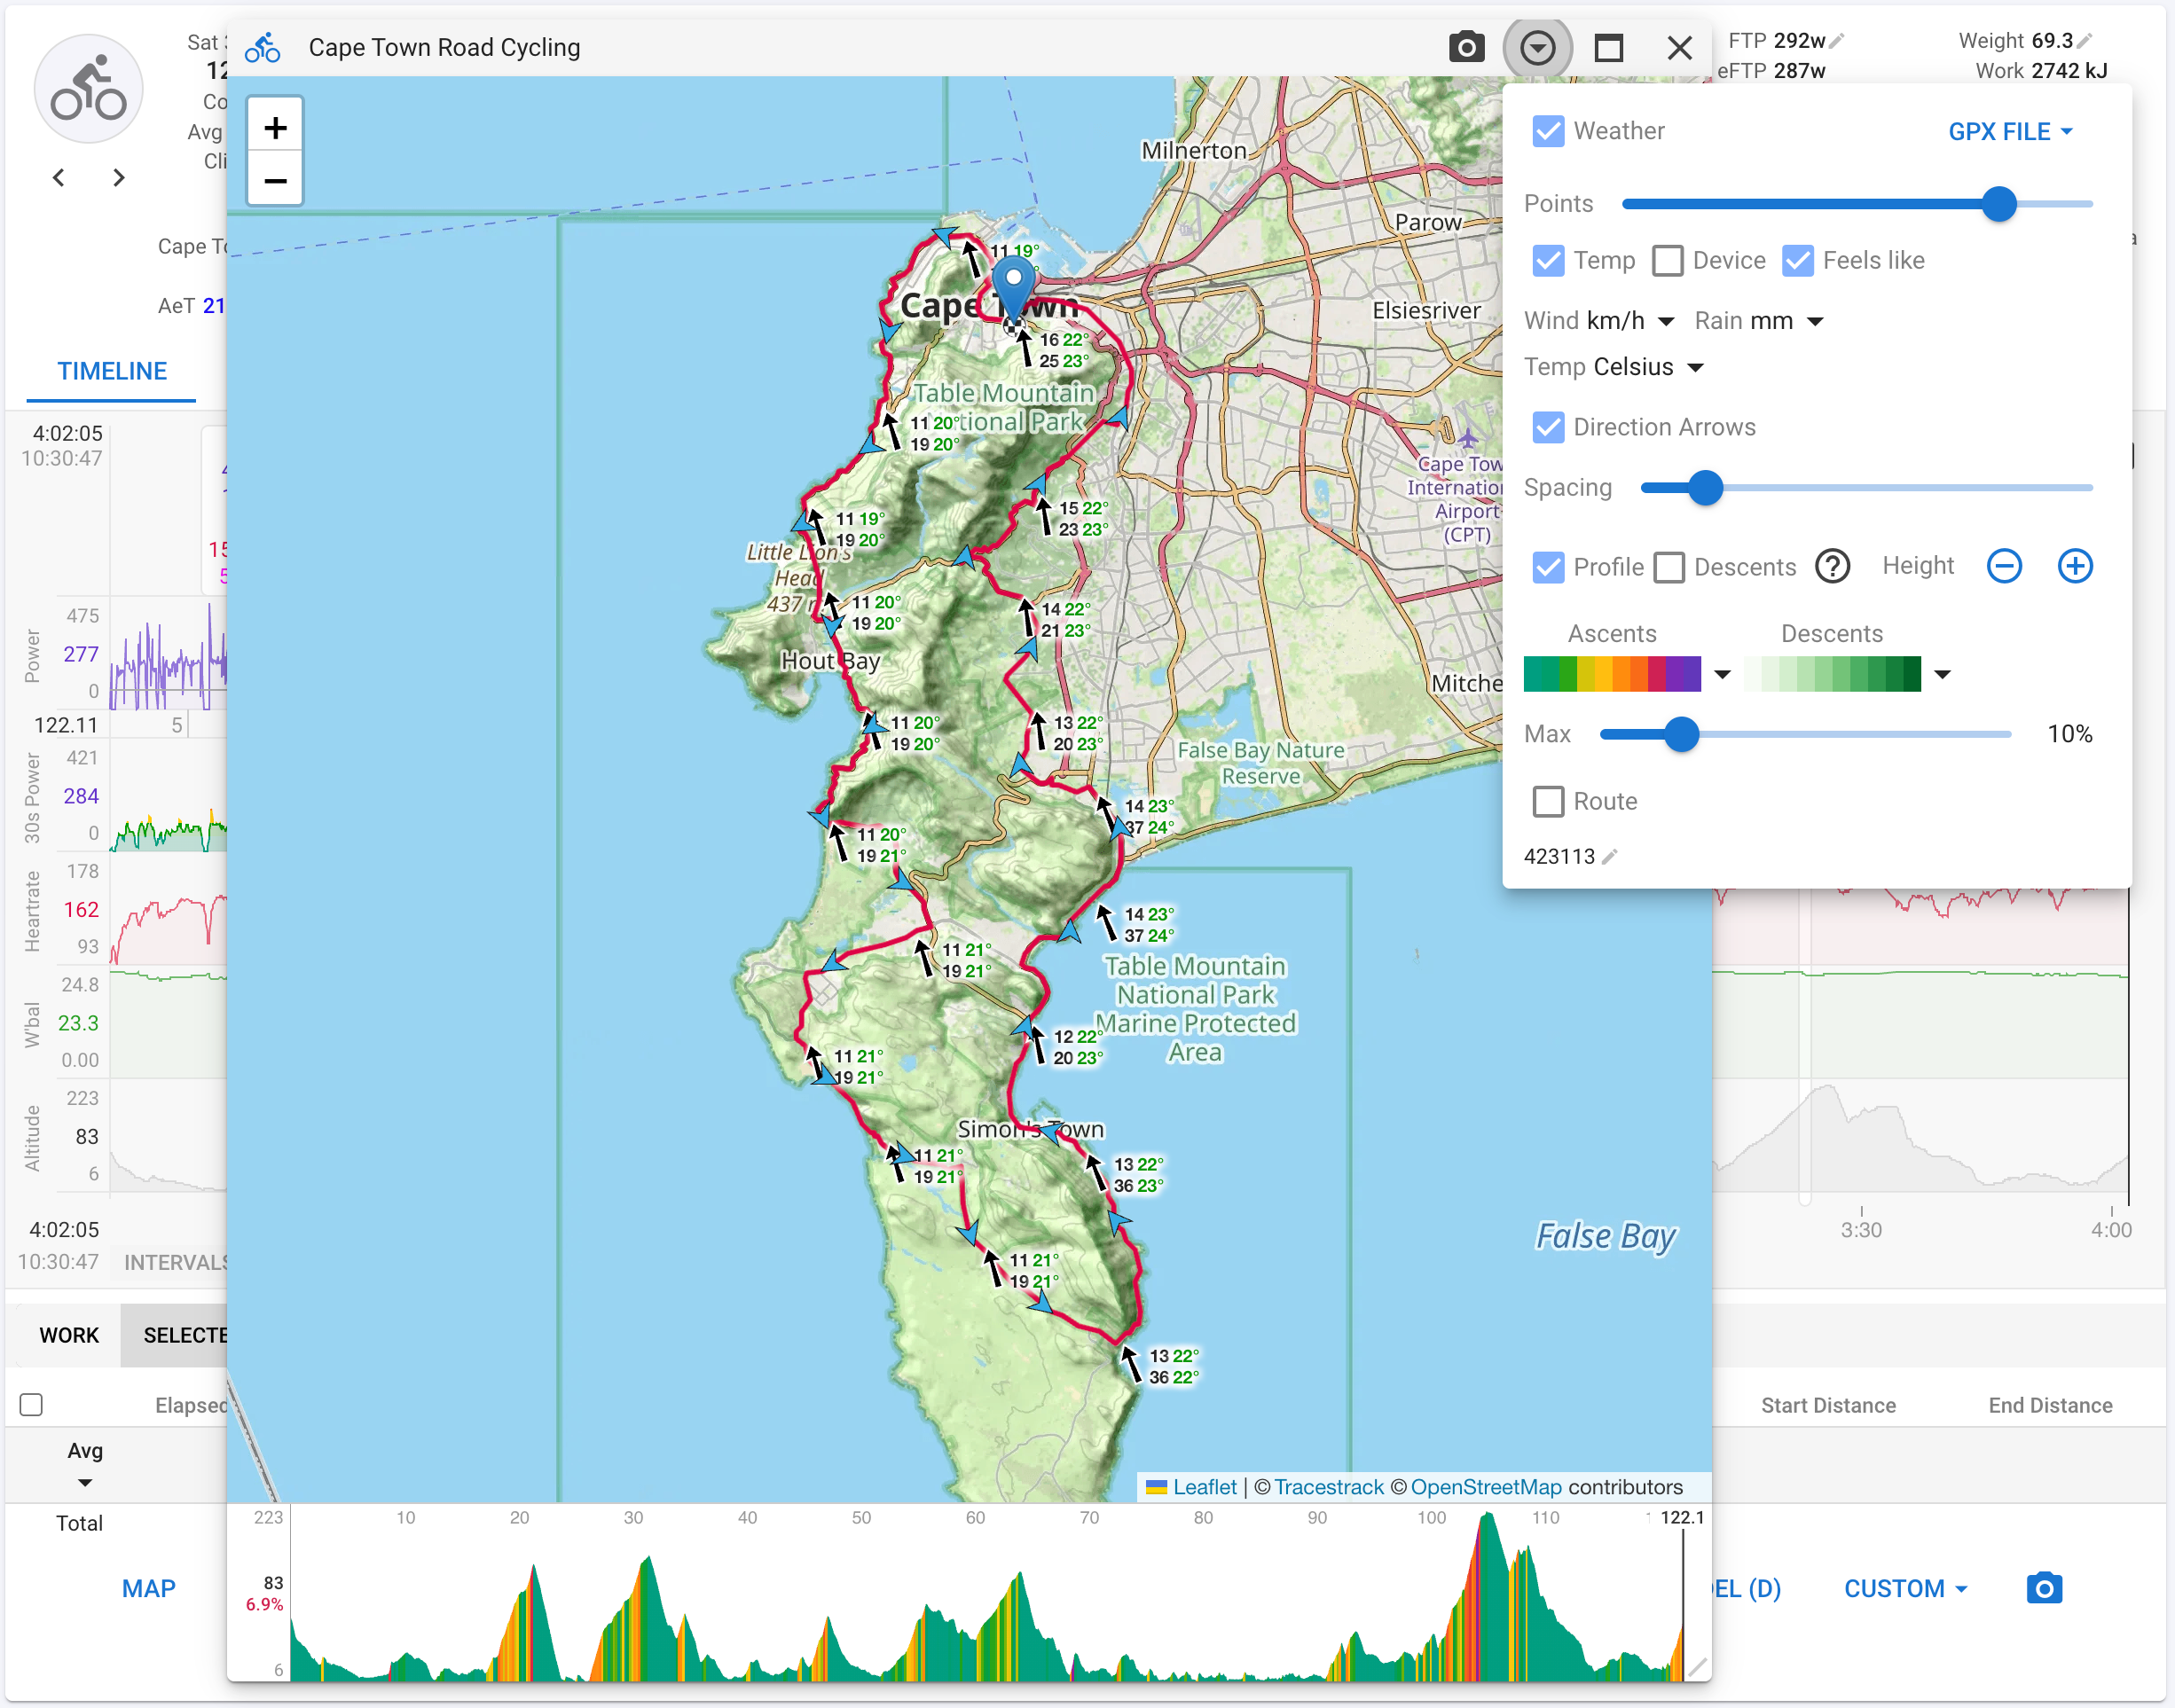
Activity Map with Weather
View your activities on an interactive map with historical and future weather data overlaid on the route. See wind direction and speed, precipitation, and temperature along your ride or run.
See the Conditions You Rode In
The activity map overlays historical and forecast weather data on your route. Understand how conditions affected your performance and choose the route with the best weather for your Saturday ride! Powered by Open-Meteo.
- Interactive route map for every outdoor activity
- Wind arrows showing direction and speed along the route
- Precipitation markers for rain and snow
- Temperature data along the route
- Forecast up to 7 days in the future for any time of day
- Historical weather data available from 2021 onwards
More in Analyze Your Activities
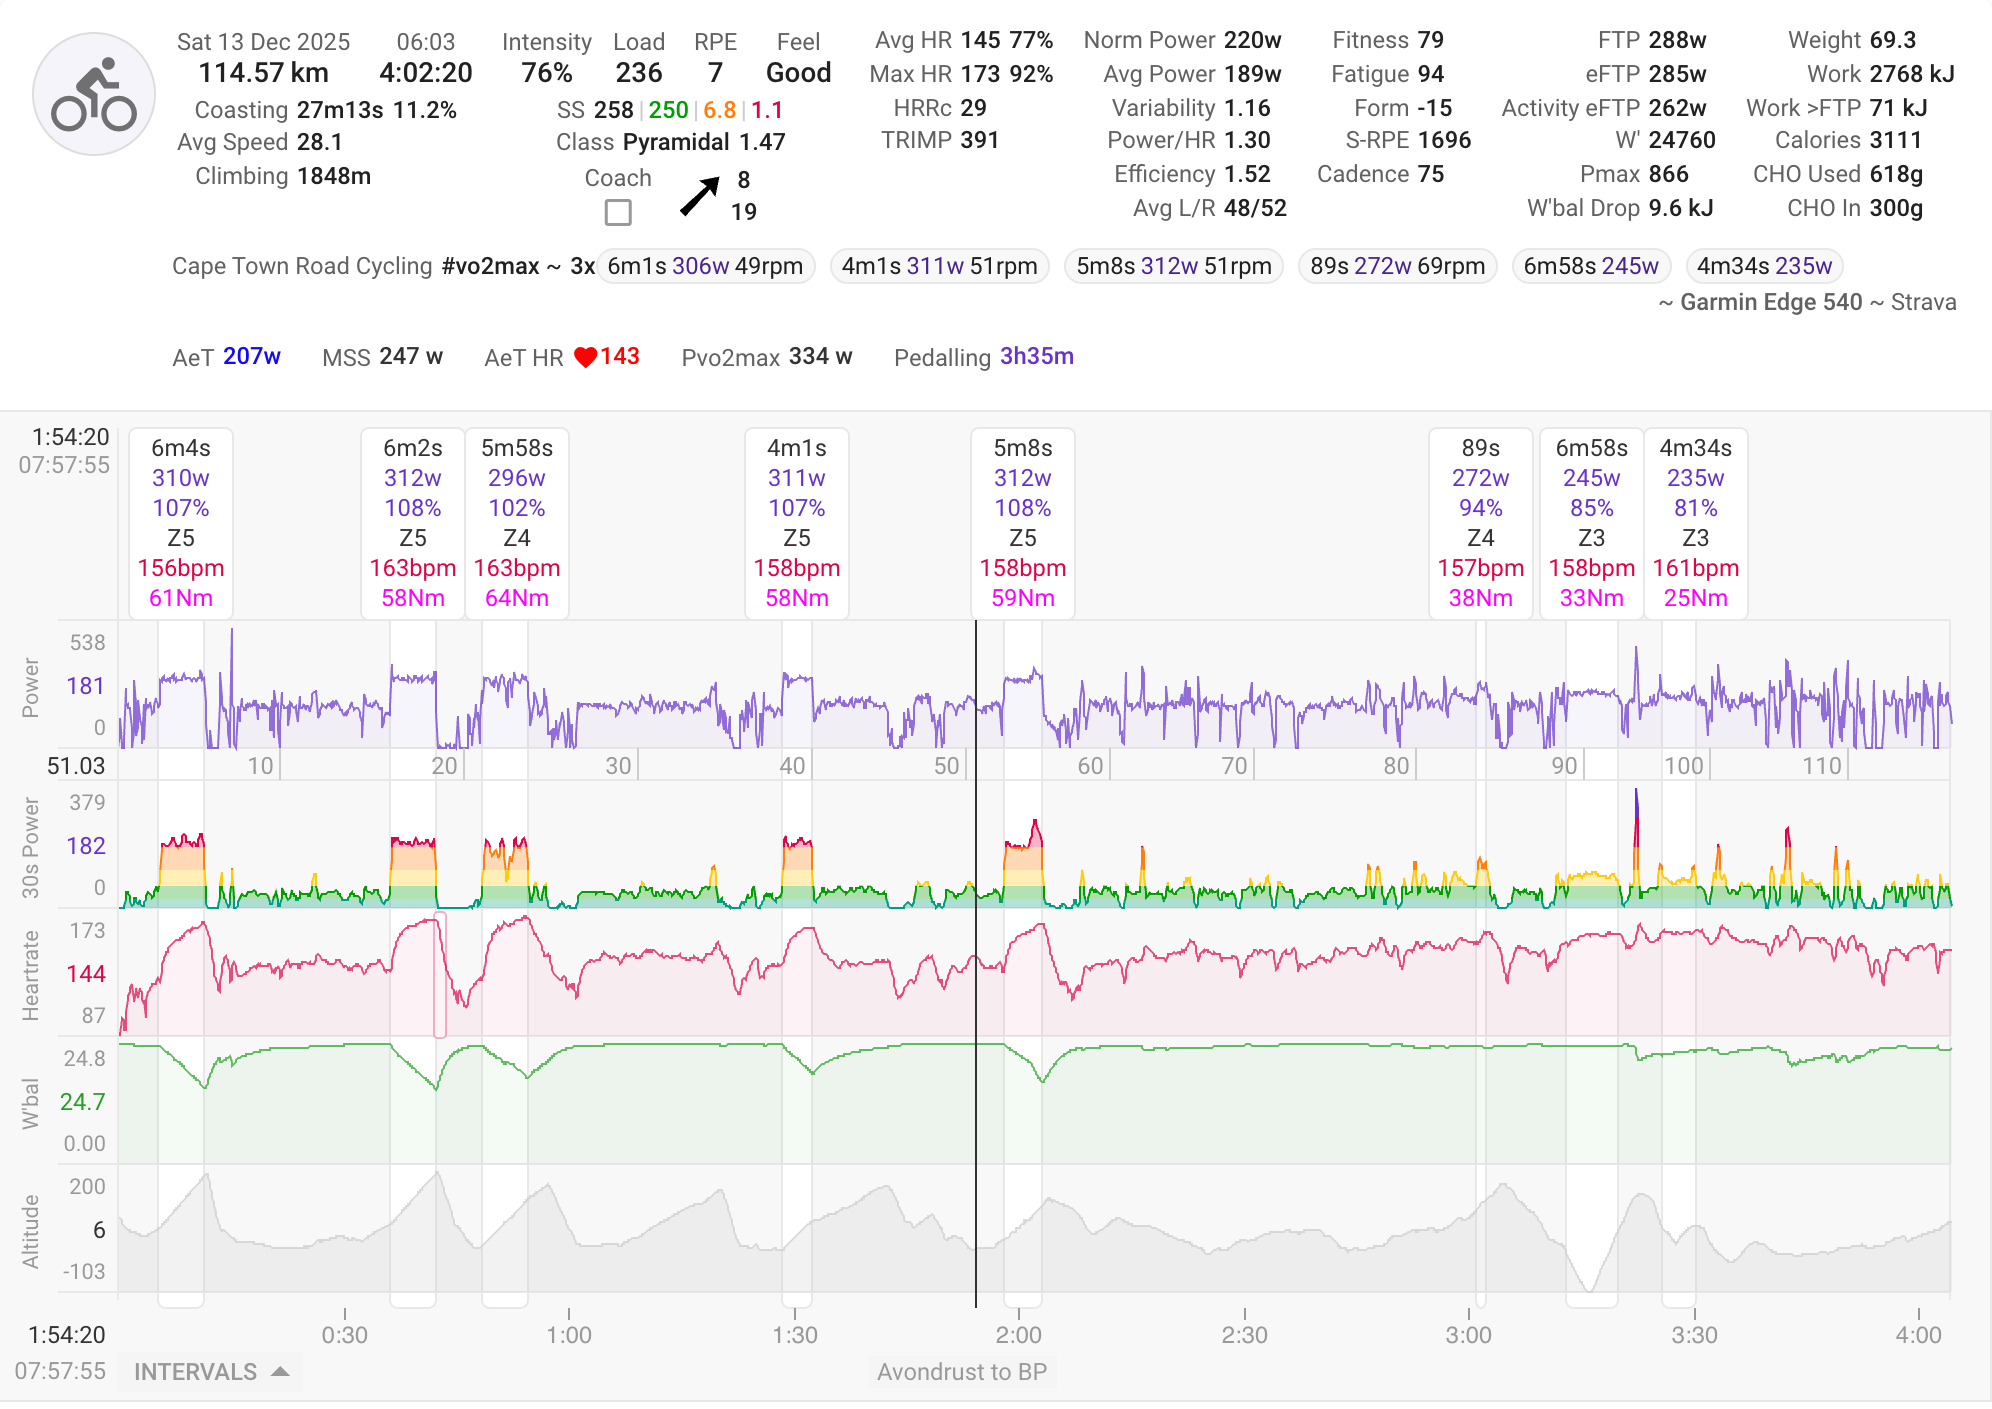
Activity Timeline
View your activity with Coggan metrics plus unique Intervals.icu metrics. Automatic interval detection finds your efforts, with spike detection and correction for power and HR data.
Learn more →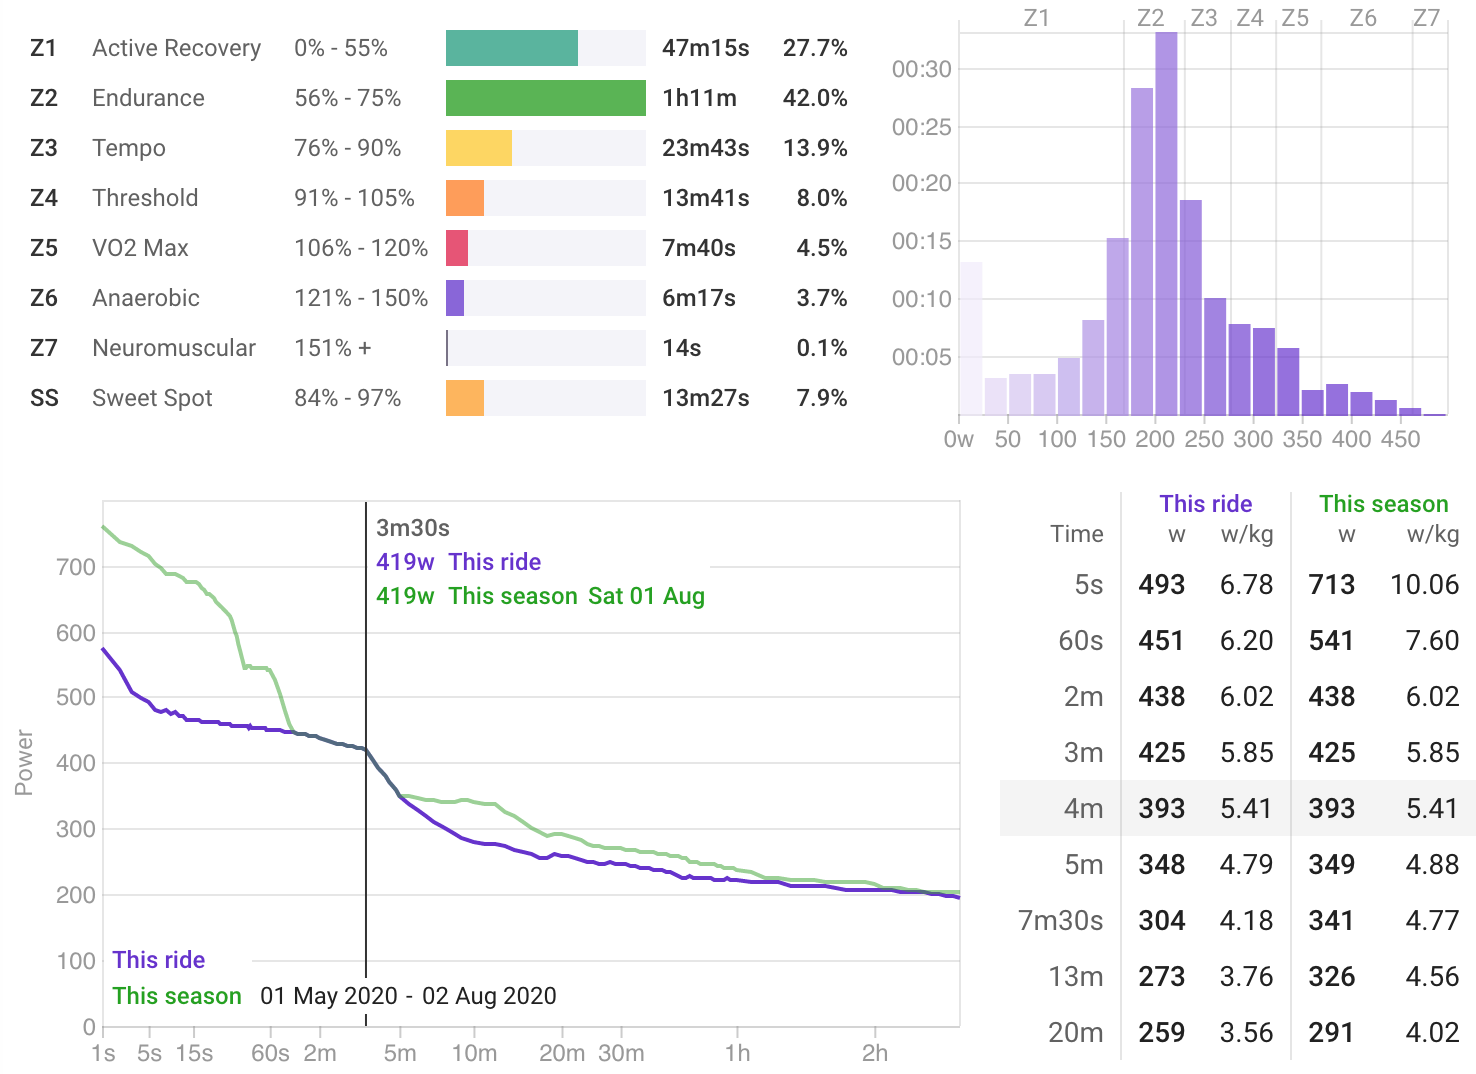
Power Charts
Analyze zone time distribution, view your 42-day power curve, histograms, and best efforts all within the context of a single activity.
Learn more →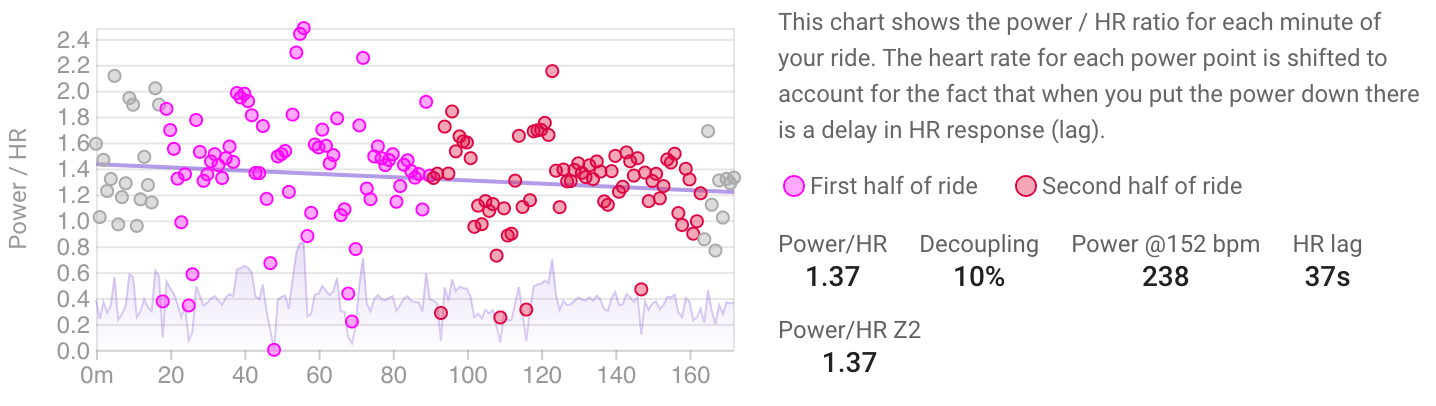
Decoupling
Track your aerobic fitness through cardiac drift analysis. The Power/HR Z2 metric provides a clear picture of your aerobic efficiency over time.
Learn more →