Track Your Progress
Monitor fitness, fatigue, and form across all your sports with powerful charts and analytics.
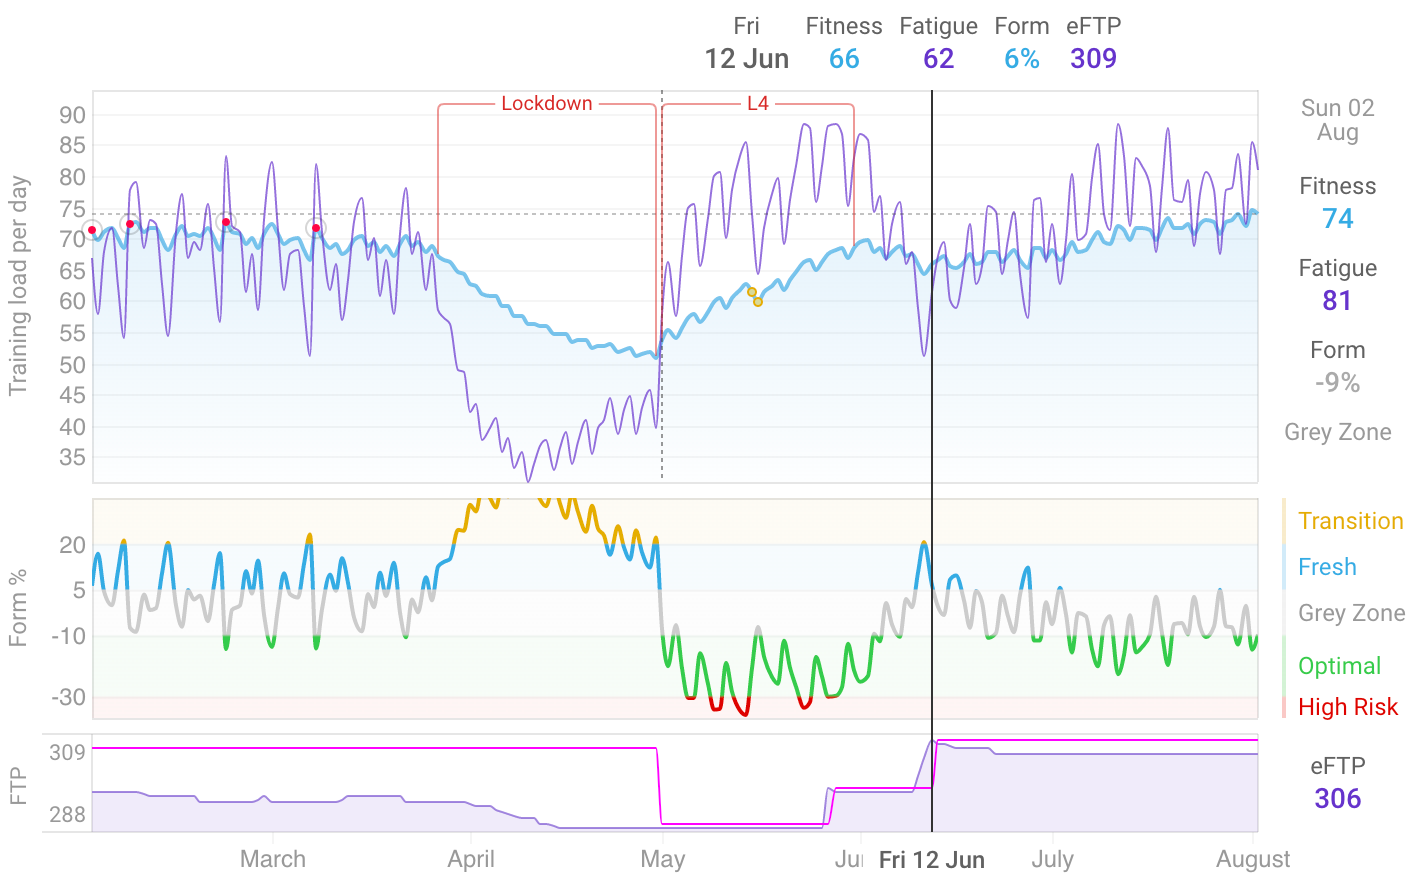
Fitness Chart
Track your long-term fitness progression with the classic Performance Management Chart. Download historical data from Strava, Garmin, and more to see your complete training history. Automatic eFTP estimation from single maximal efforts keeps your zones up to date.
Learn more →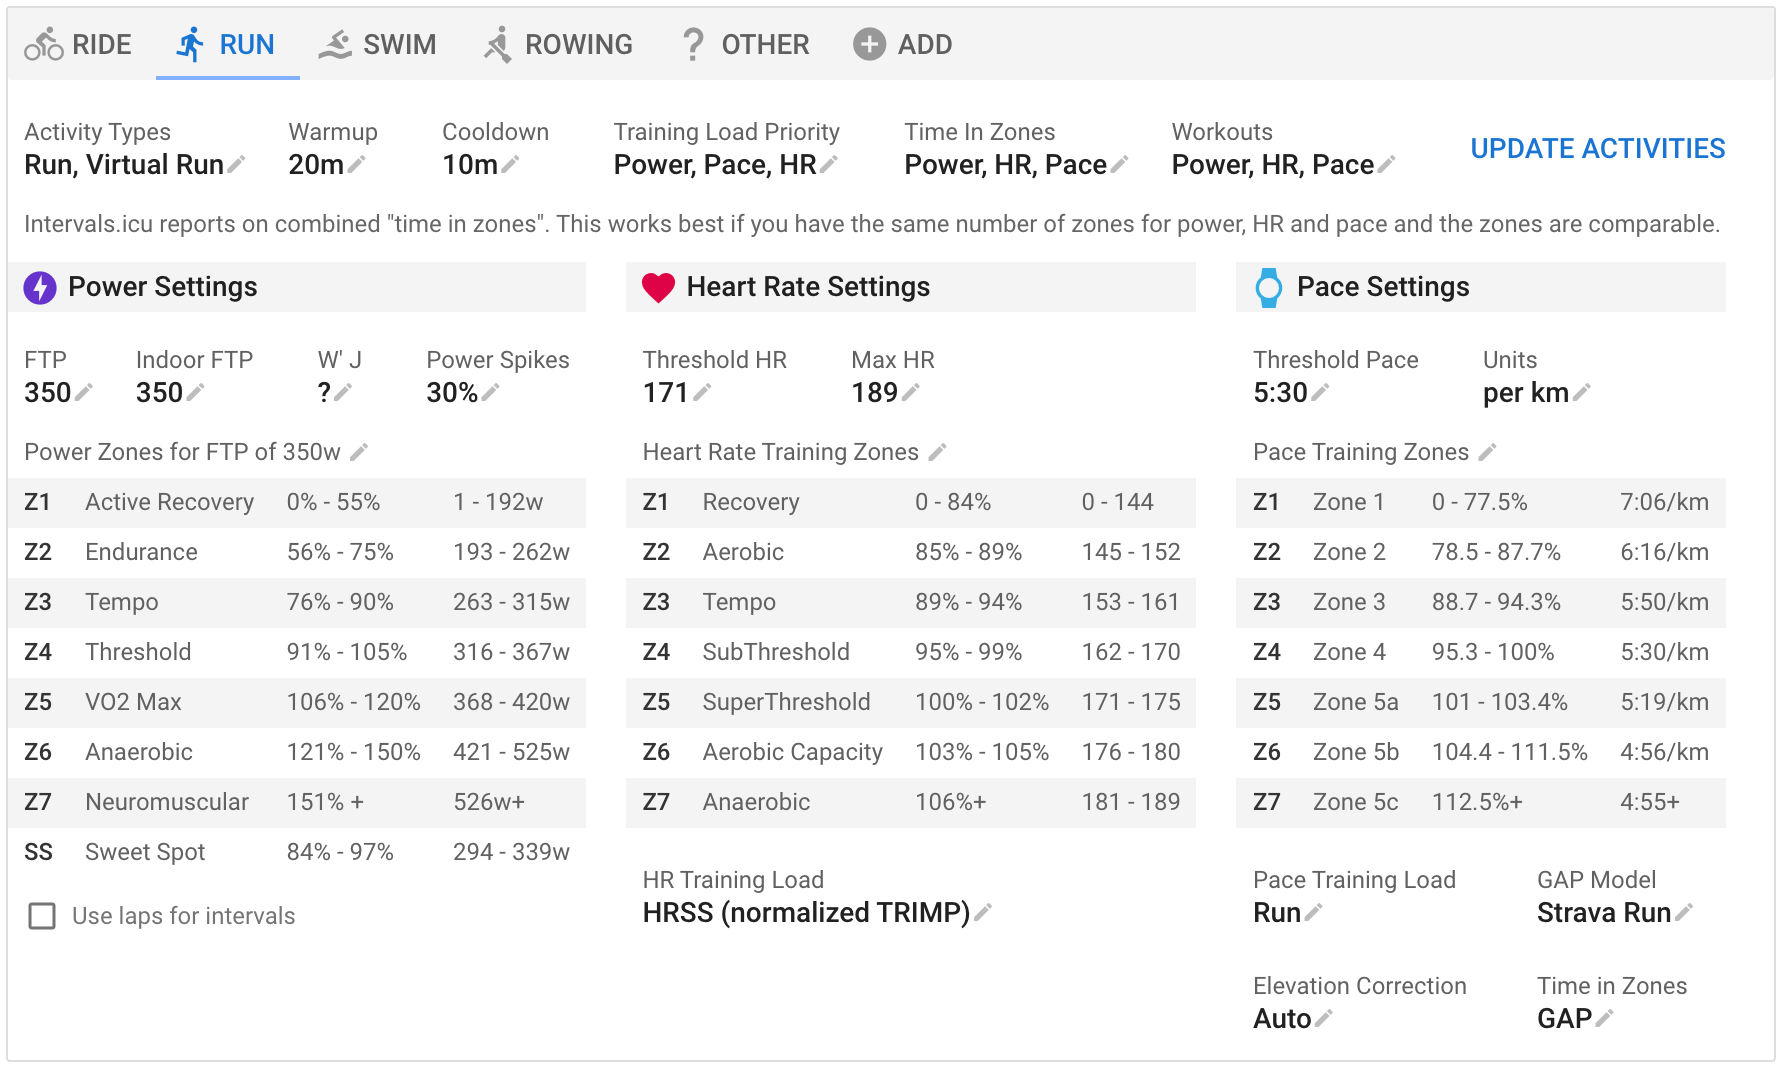
Multisport
Separate zones and settings per sport. Whether you ride, run, swim, row or do all four, Intervals.icu tracks each discipline independently with appropriate metrics and calculations.
Learn more →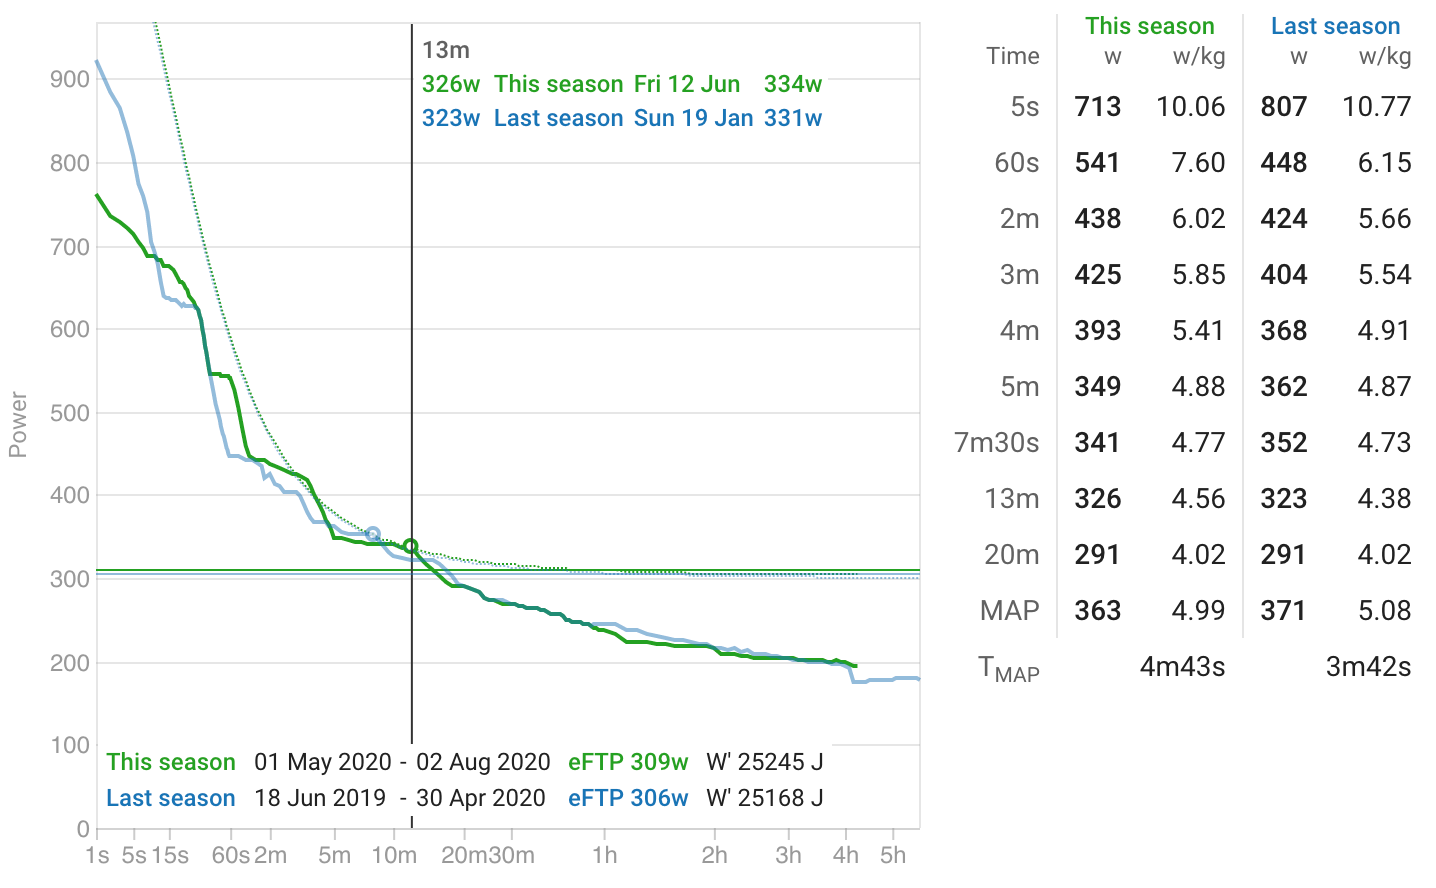
Power Curve
Compare your power curve across seasons, view watts per kilogram, and estimate your MAP. Multiple modelling algorithms including eFTP, Morton's 3P, and Monod & Scherrer help you understand your strengths.
Learn more →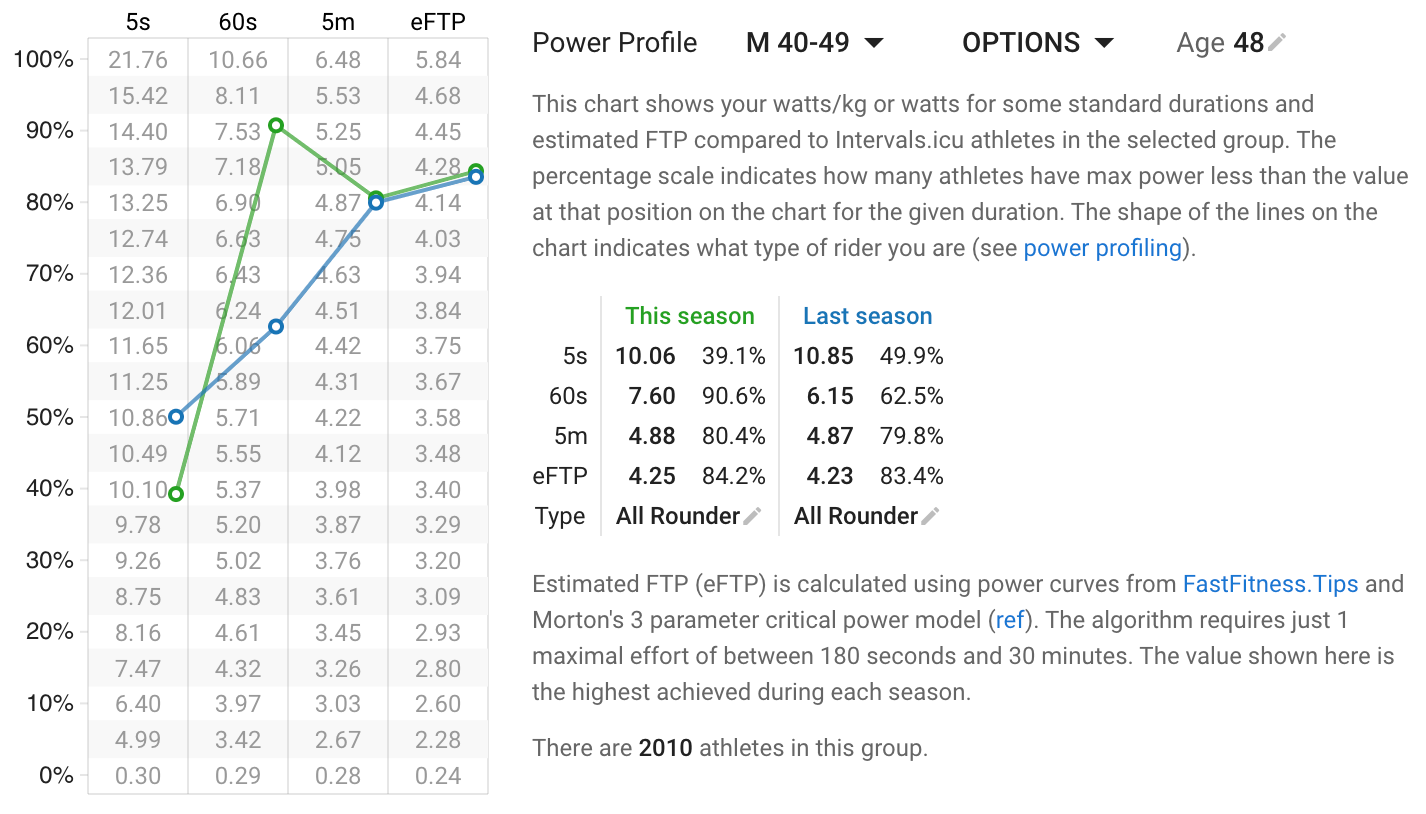
Power Rankings
See how your power compares to other athletes in your age group. View rankings by watts per kilogram and absolute watts to understand where you stand.
Learn more →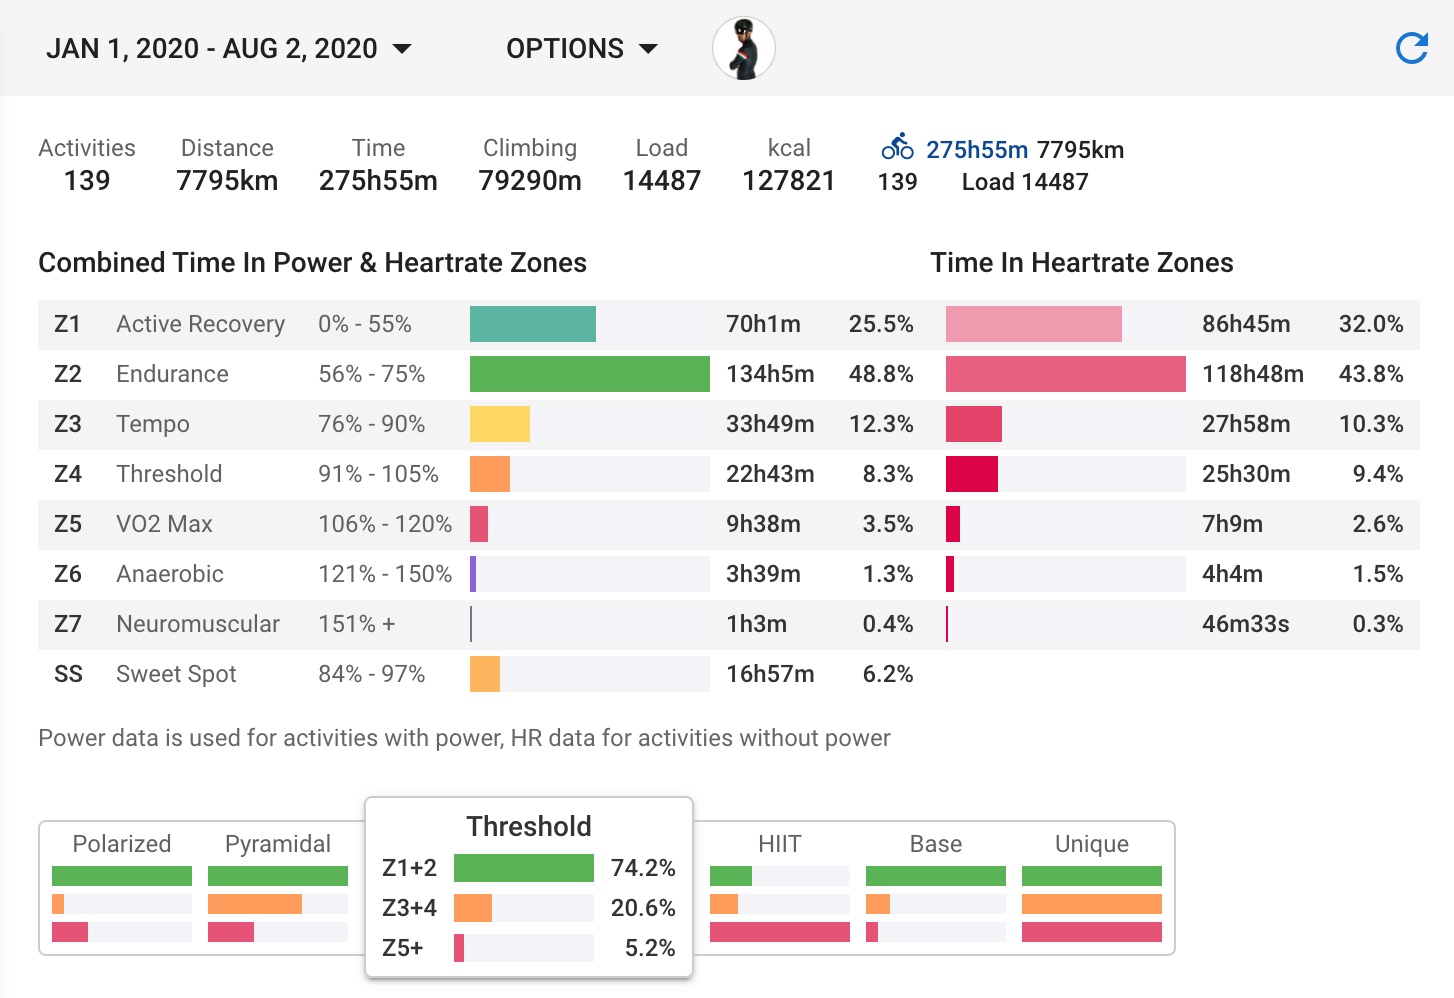
Activity Totals
View totals by sport including distance, time, elevation, and zone time. Classify your fitness level using data from FastFitness.Tips.
Learn more →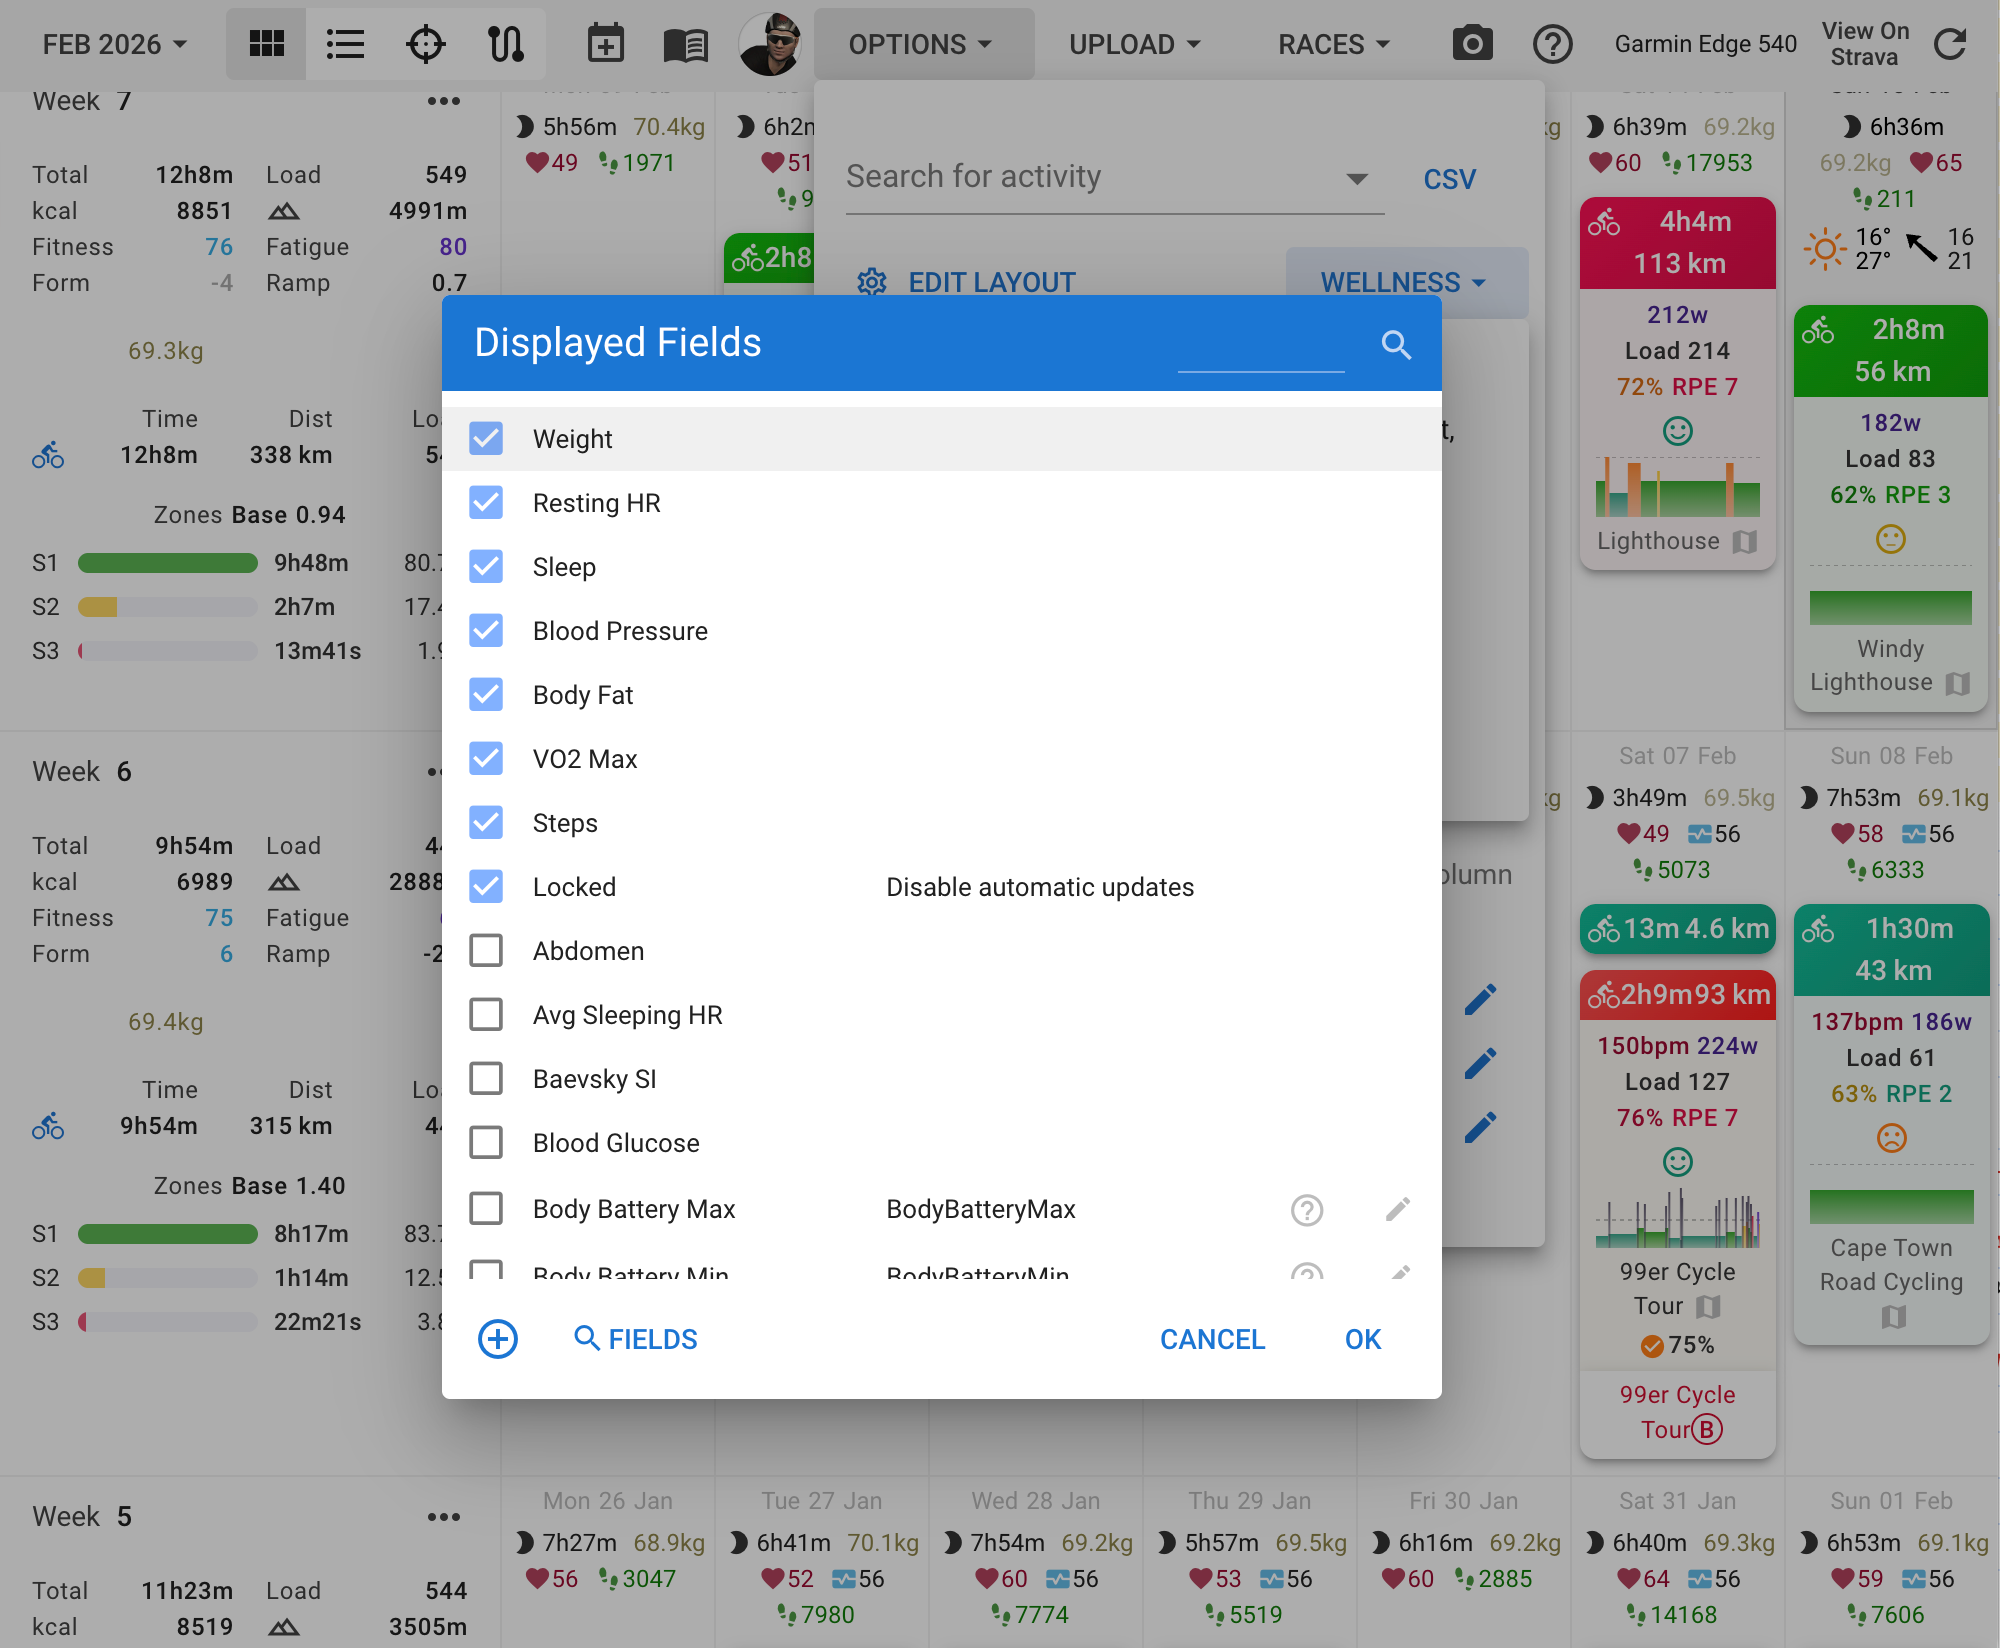
Wellness
Track weight, sleep, HRV, readiness, glucose, menstrual cycle, stress, mood, hydration, SpO2, and many more. Auto-sync from Garmin, Polar, Oura, Amazfit, Huawei and more.
Learn more →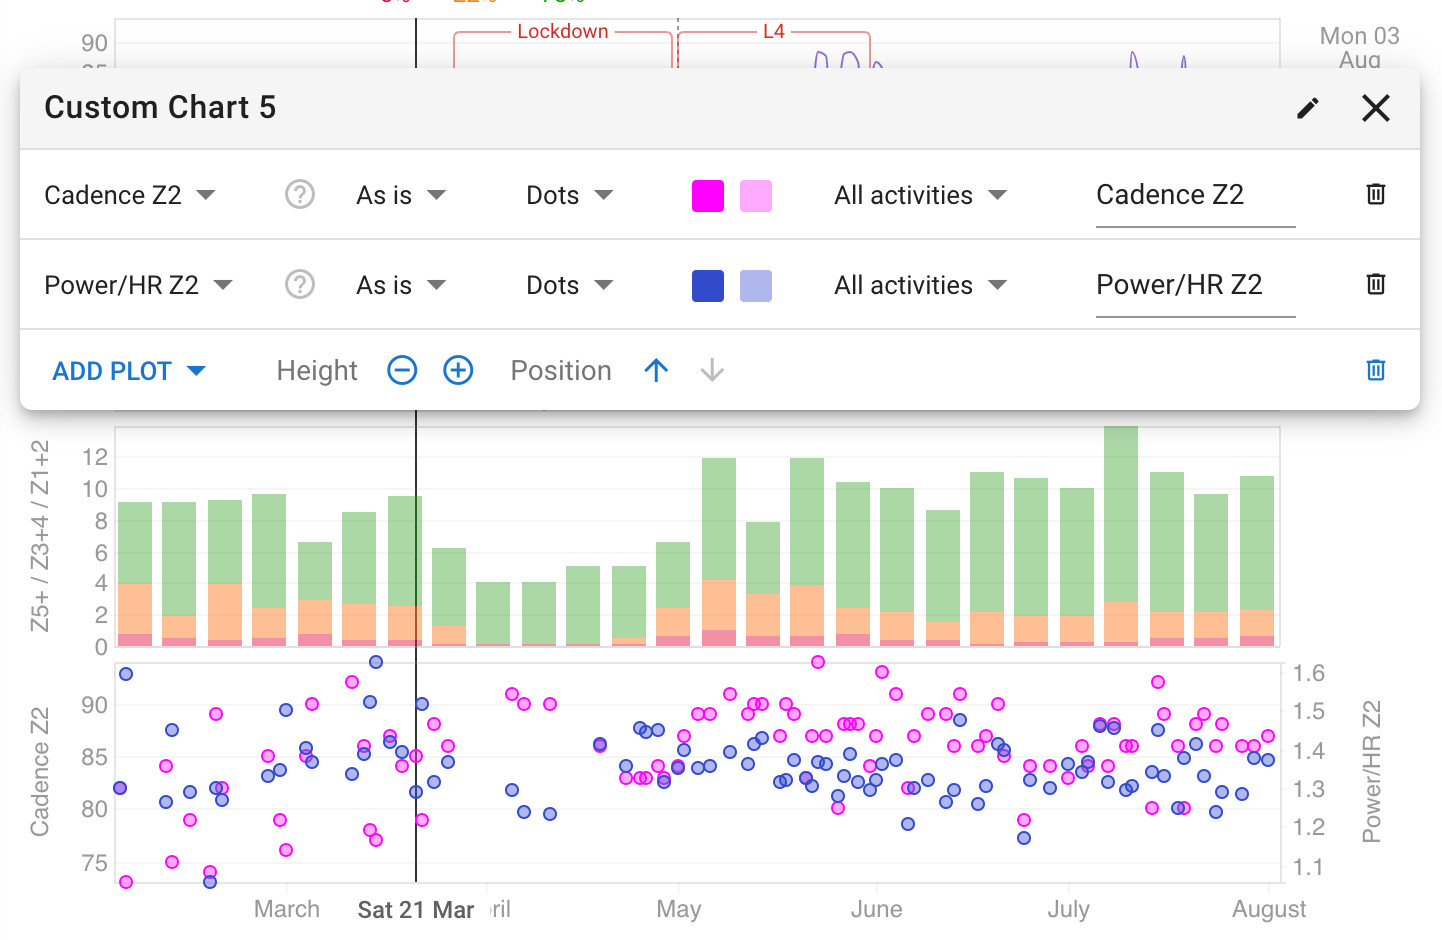
Custom Charts
Build your own charts from more than 70 different metrics with 10 aggregation types. Plot HR recovery, power/HR ratios, cadence, efficiency, RPE, W' balance, and much more.
Learn more →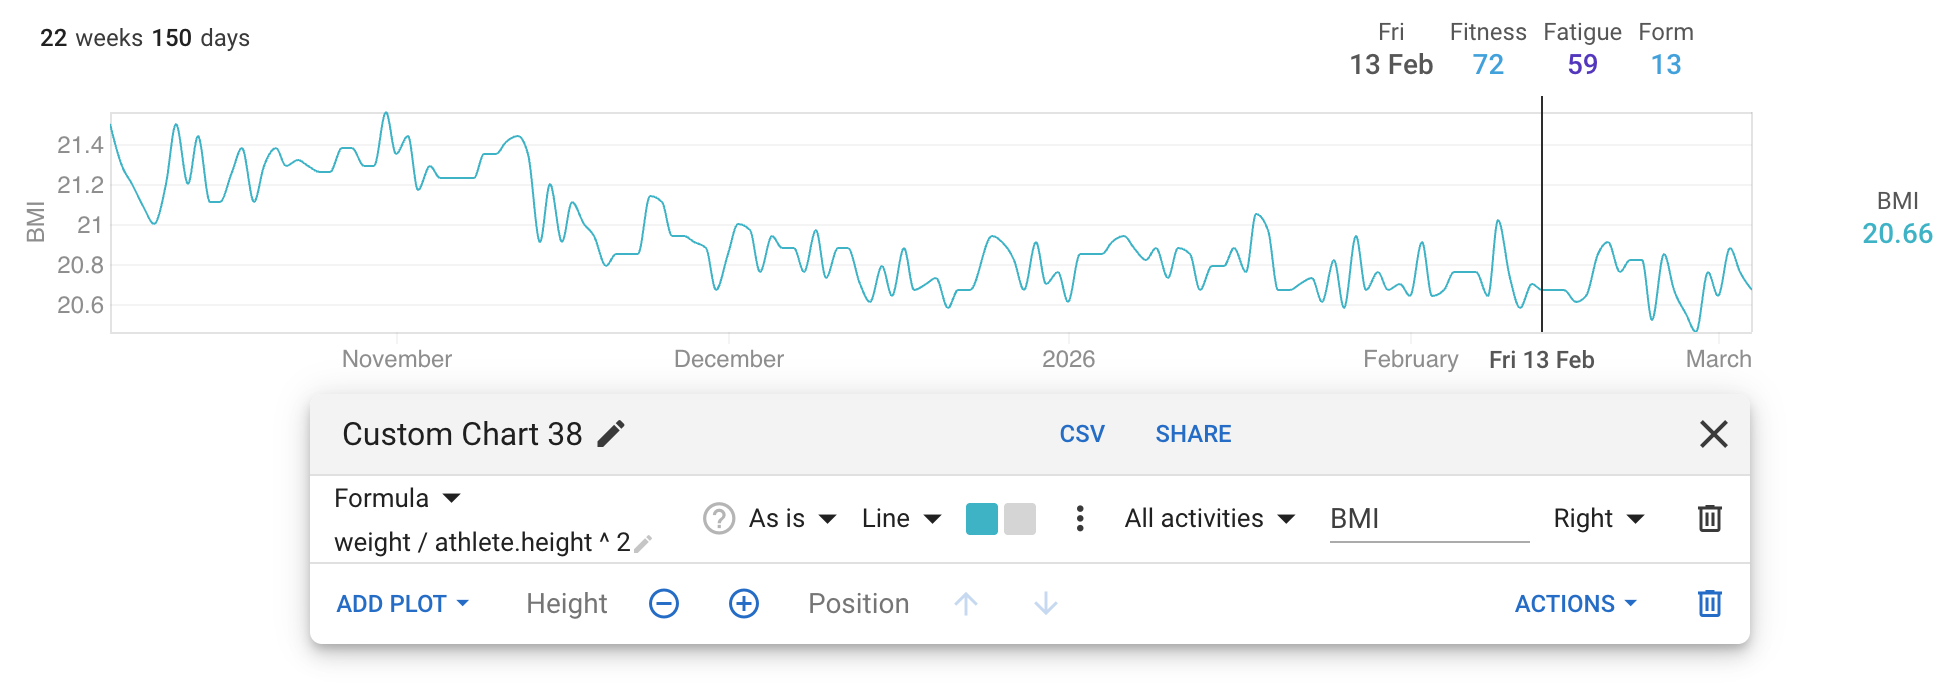
Custom Formulas
Create calculated metrics on your fitness charts using simple mathematical formulas. Compute BMI from weight and height, build your own exponential weighted moving averages, calculate heart rate zone percentages, and more — no coding required.
Learn more →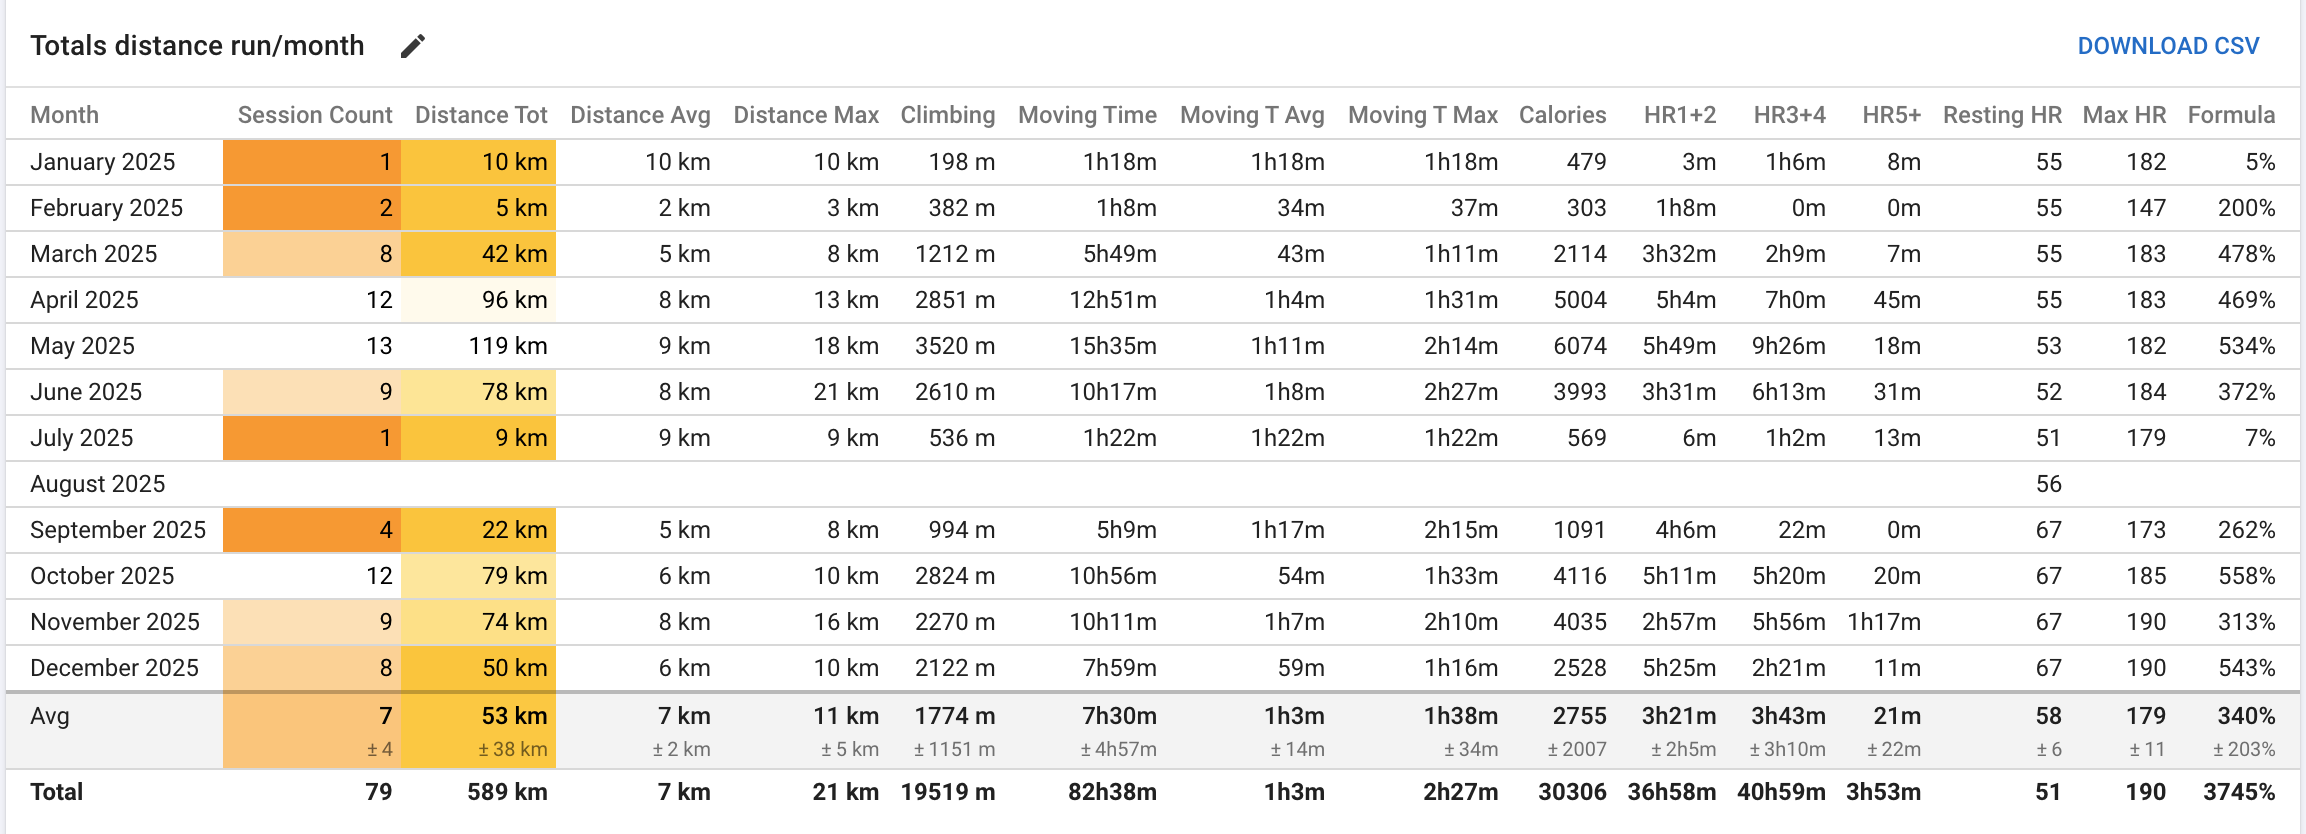
Totals Tables
Add configurable summary tables to your fitness, totals, and compare pages. Group data by day, week, month, year, or season, with color-coded columns, delta comparisons, and multiple aggregation methods.
Learn more →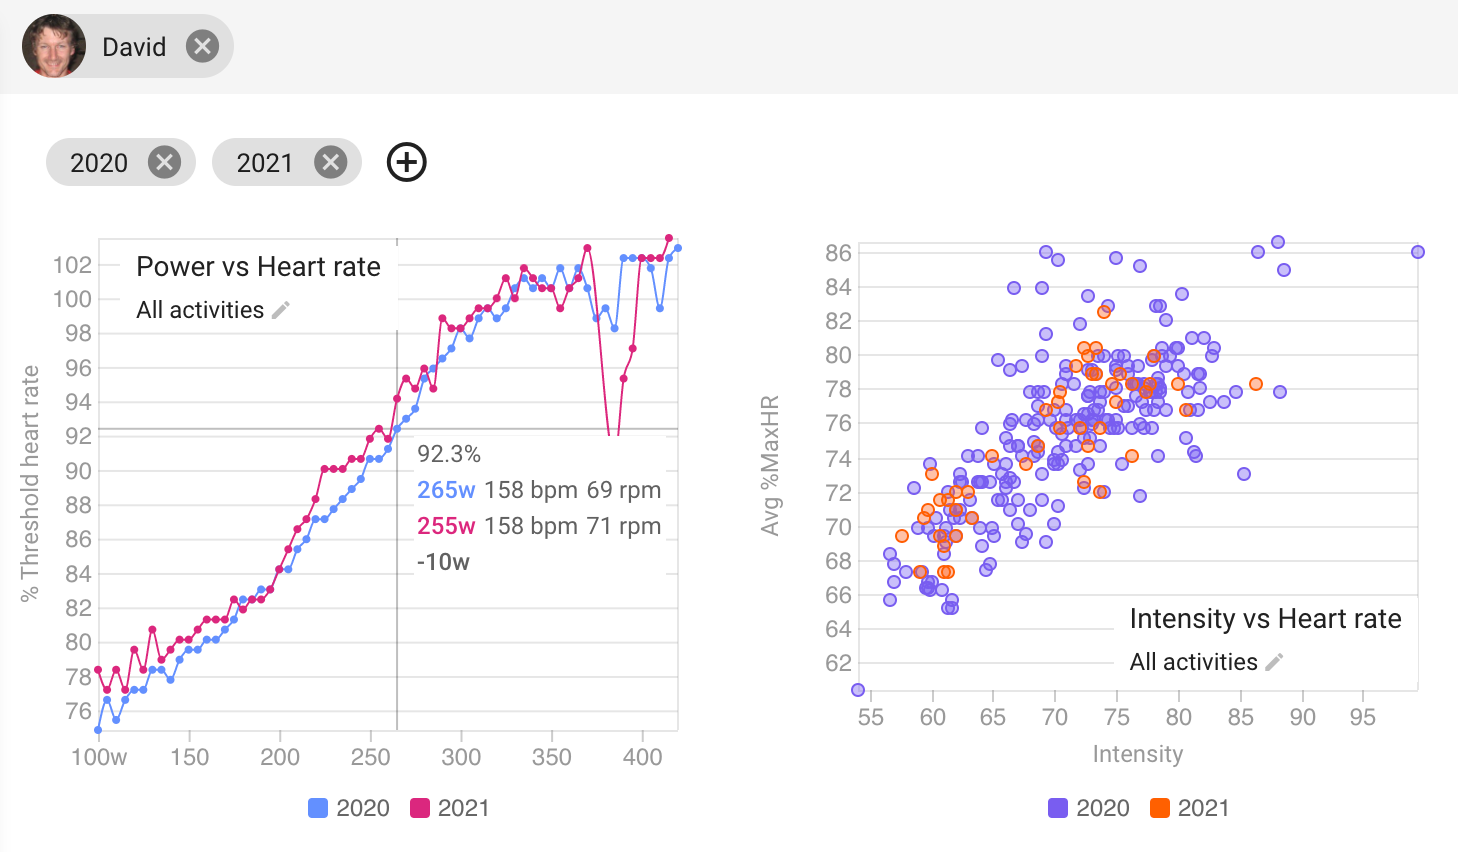
Compare
Compare any two or more time periods to track your progression. Spot trends in power vs HR without formal lab testing.
Learn more →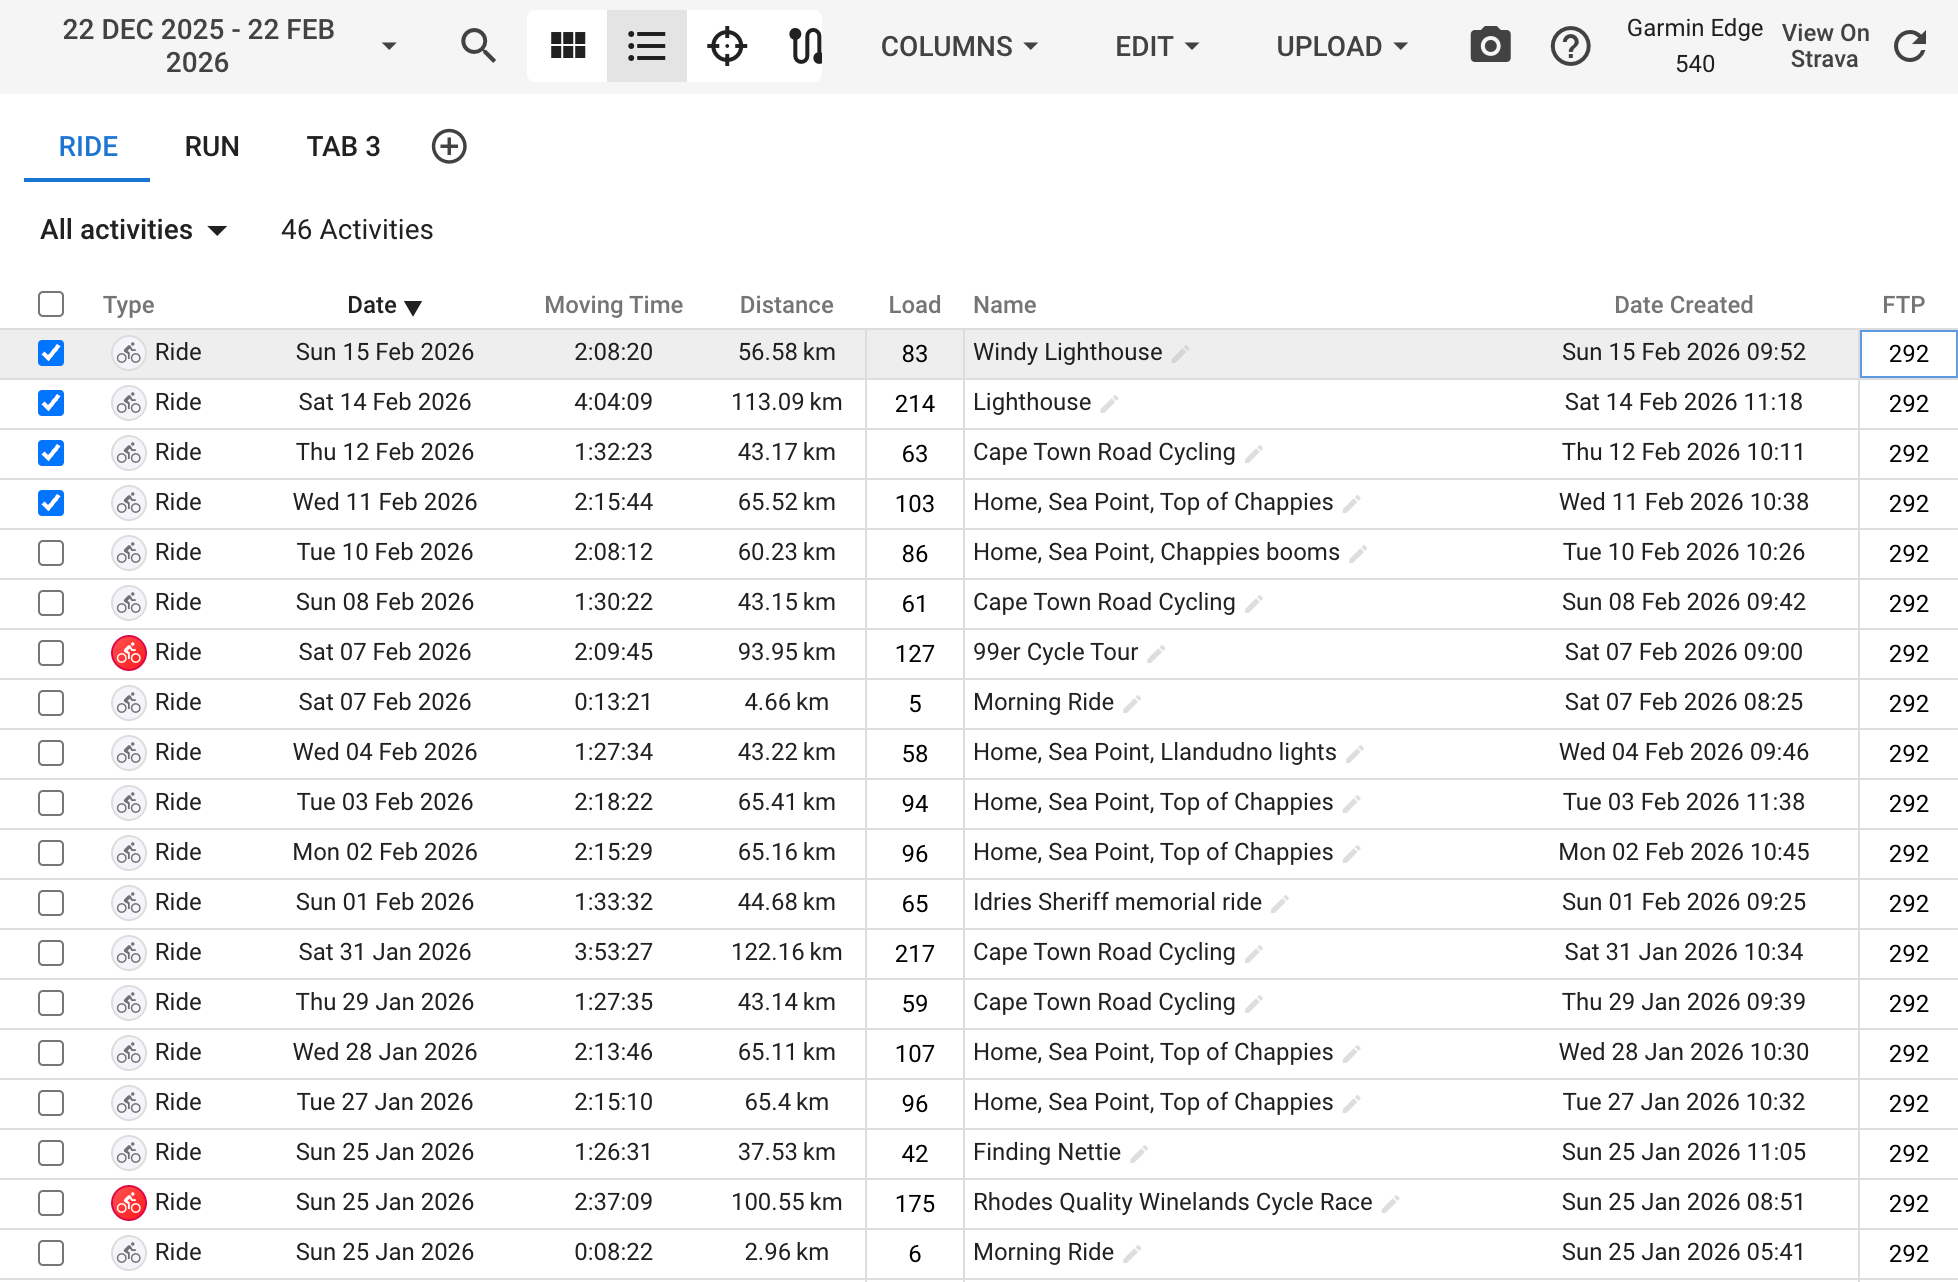
Manage Activities
View all your activities in a powerful grid with more than 70 columns to choose from. Perform batch operations to quickly organize and manage your training data.
Learn more →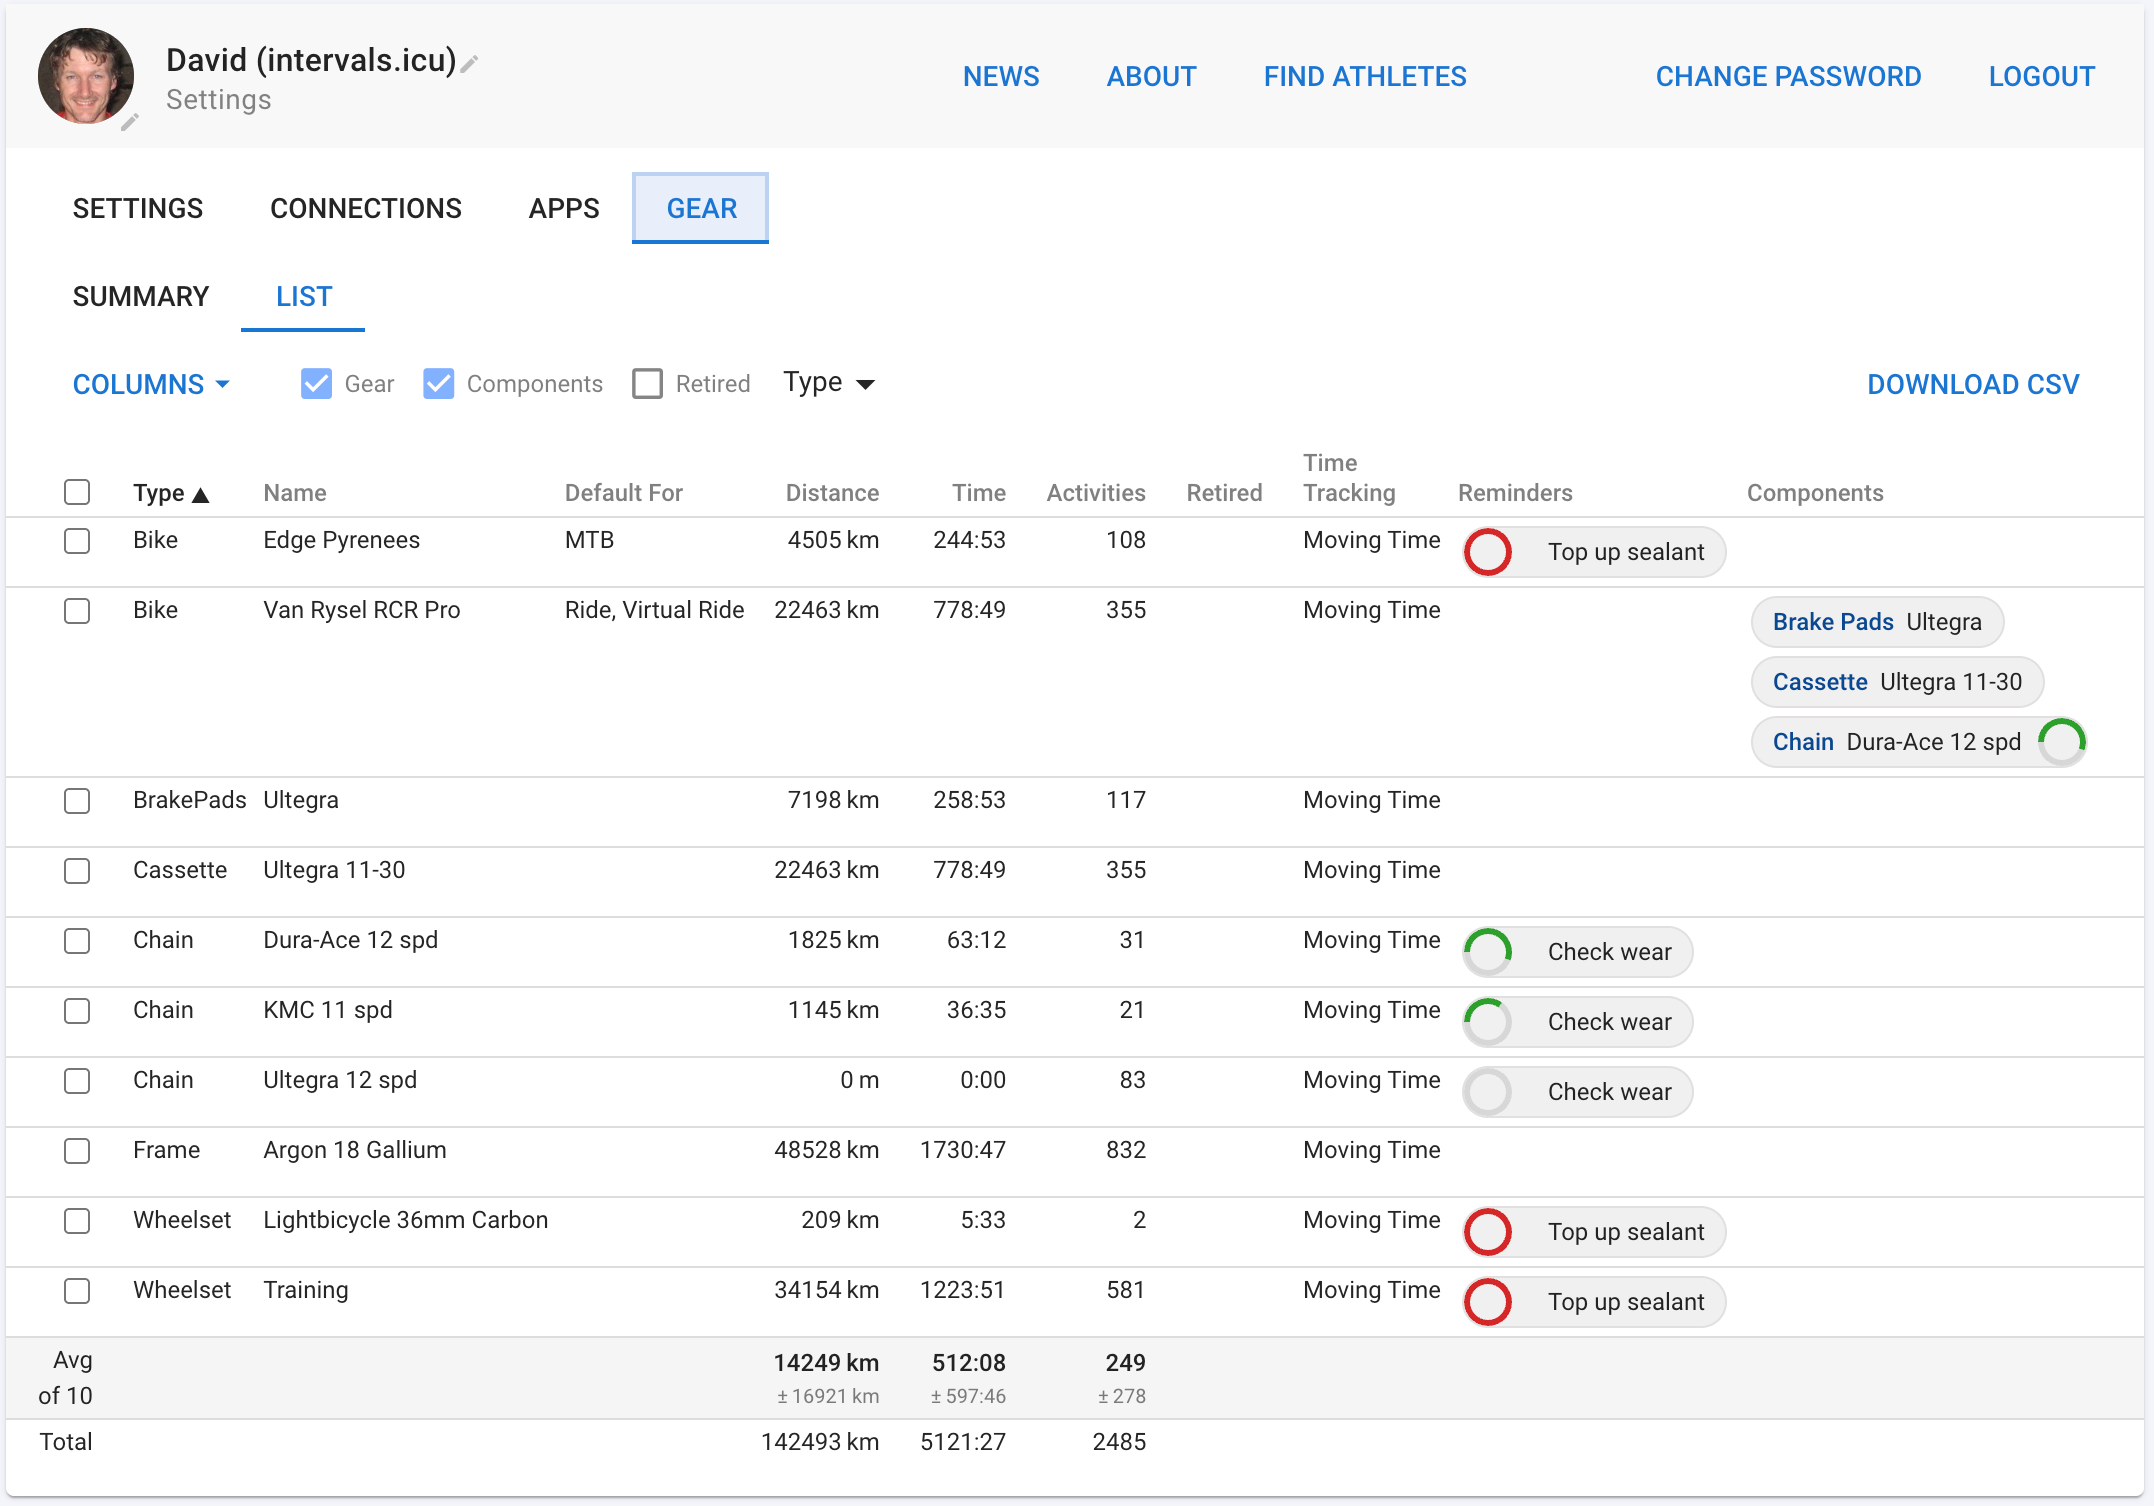
Gear Tracking
Track mileage, time, and activity count for your bikes, shoes, and other gear with reminders. Filter, sort, and export your gear data. Associate gear with activities to automatically calculate usage statistics.
Learn more →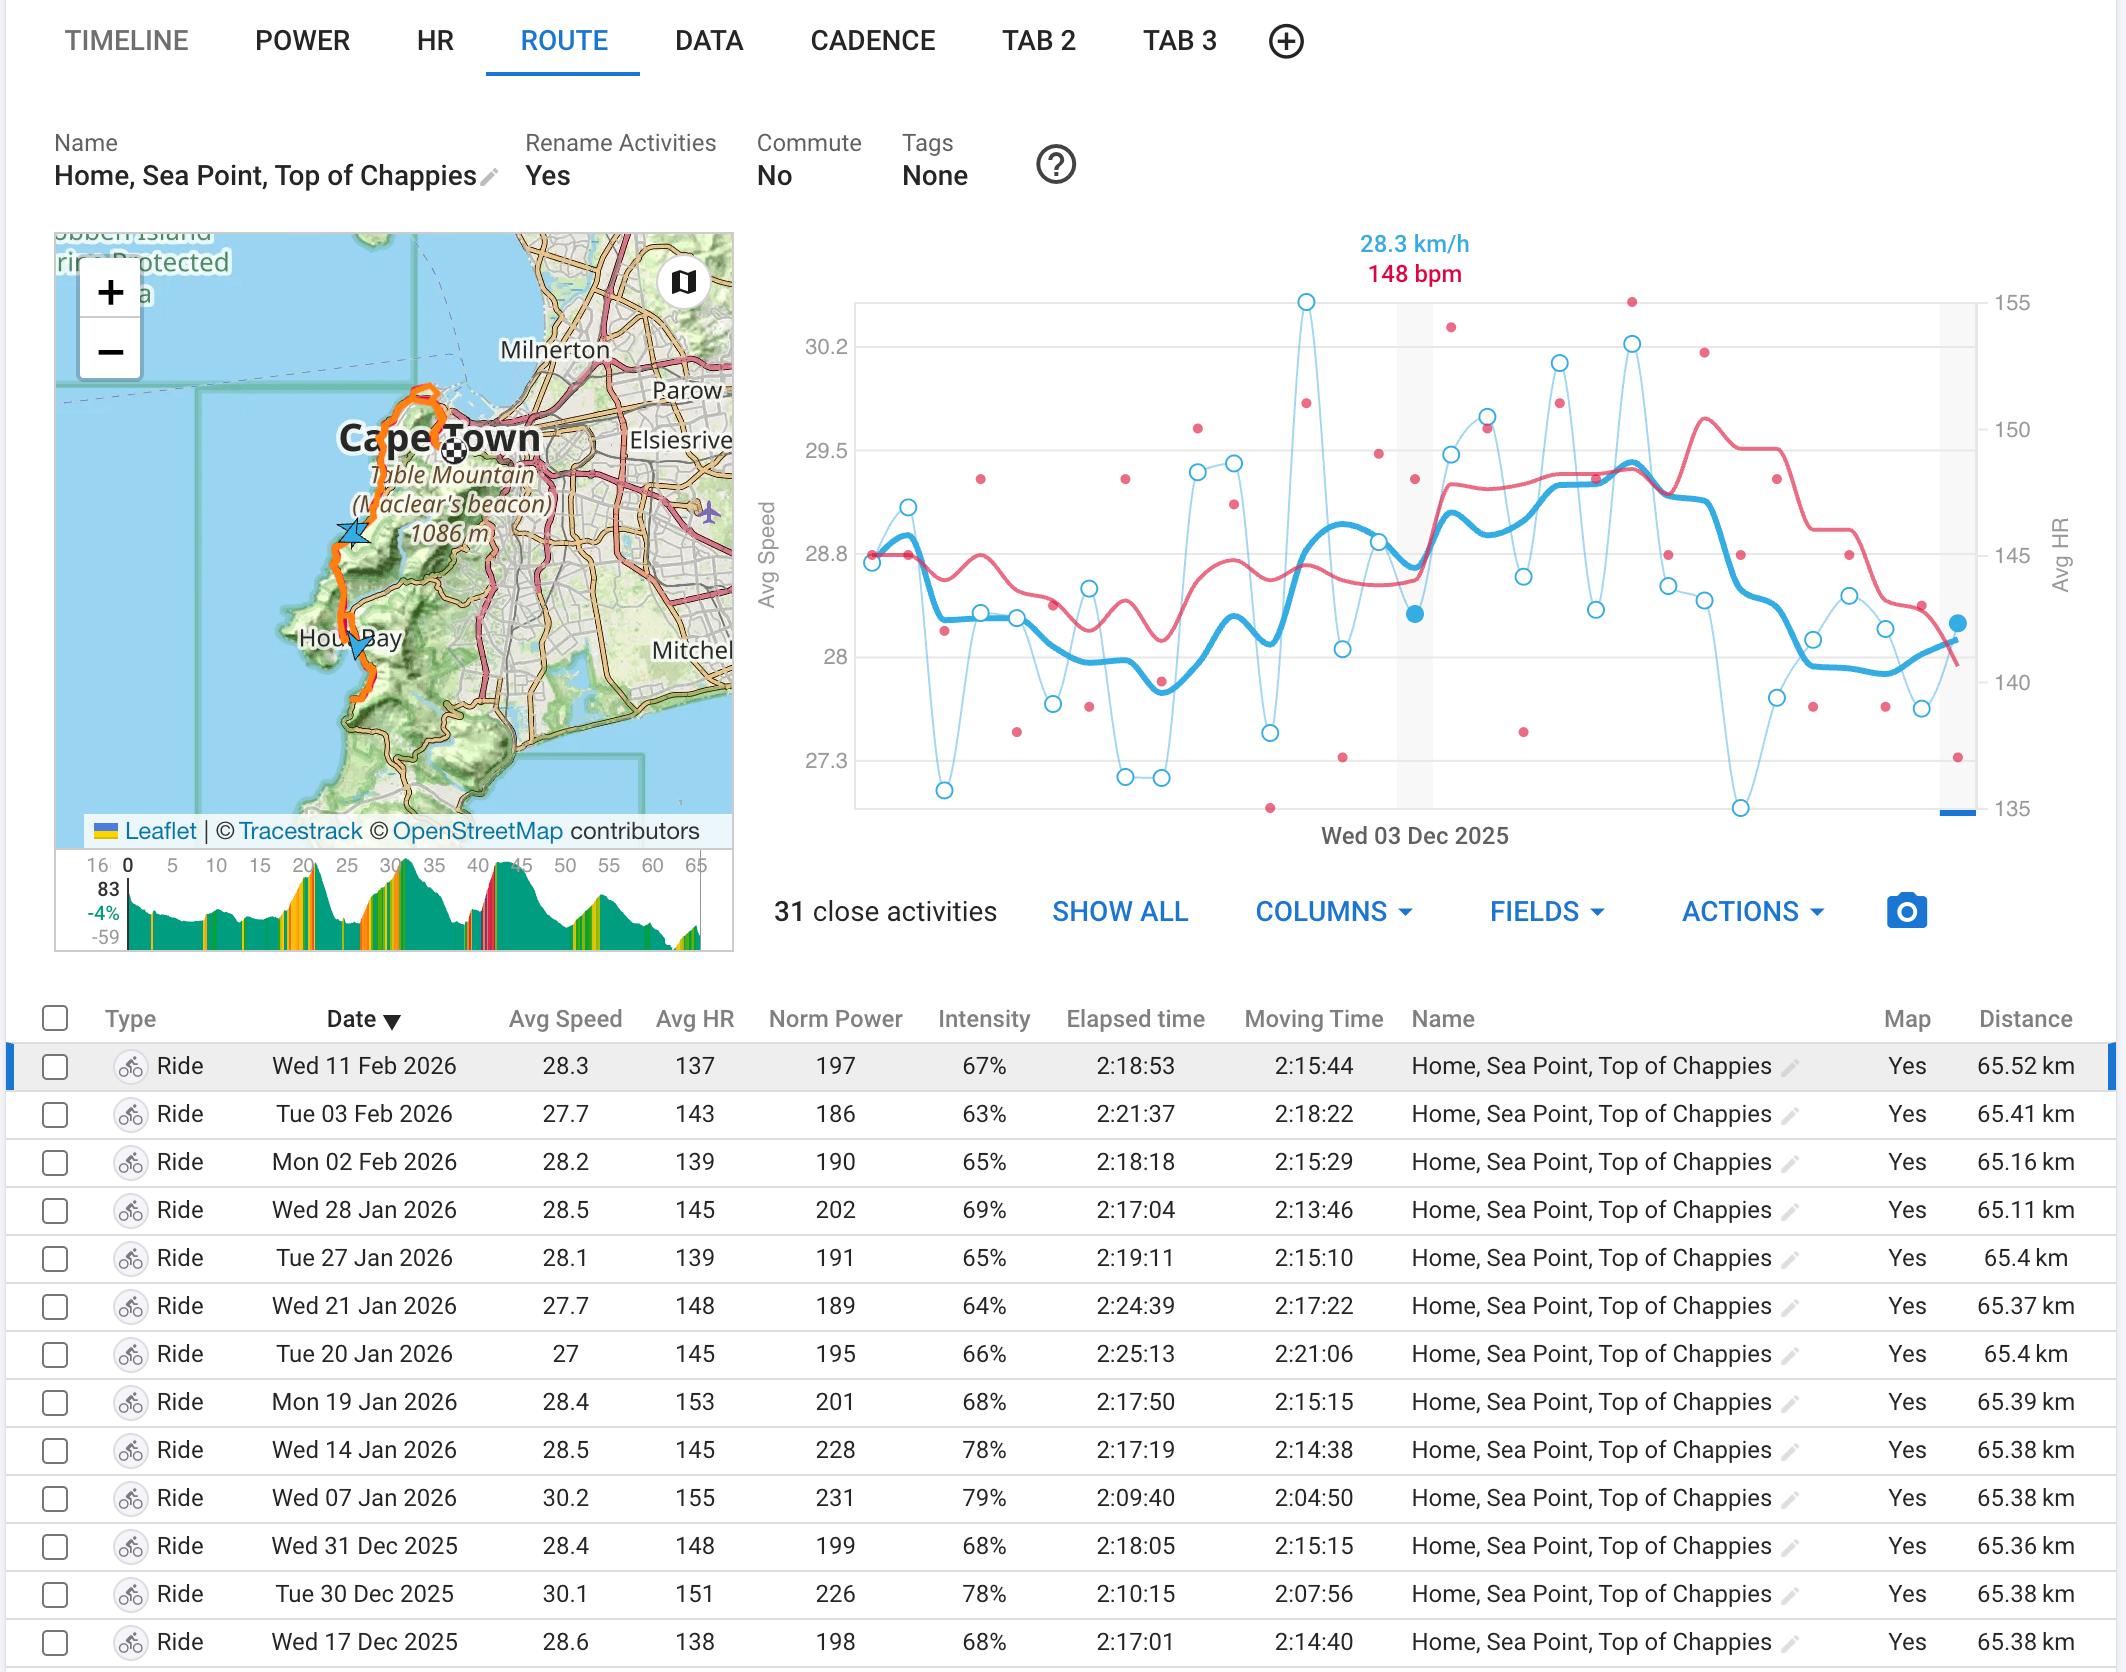
Routes
Intervals.icu automatically recognizes your favourite routes and tracks your progress over time. Activities are named and tagged based on matched routes, with trend charts showing improvement across repeated efforts.
Learn more →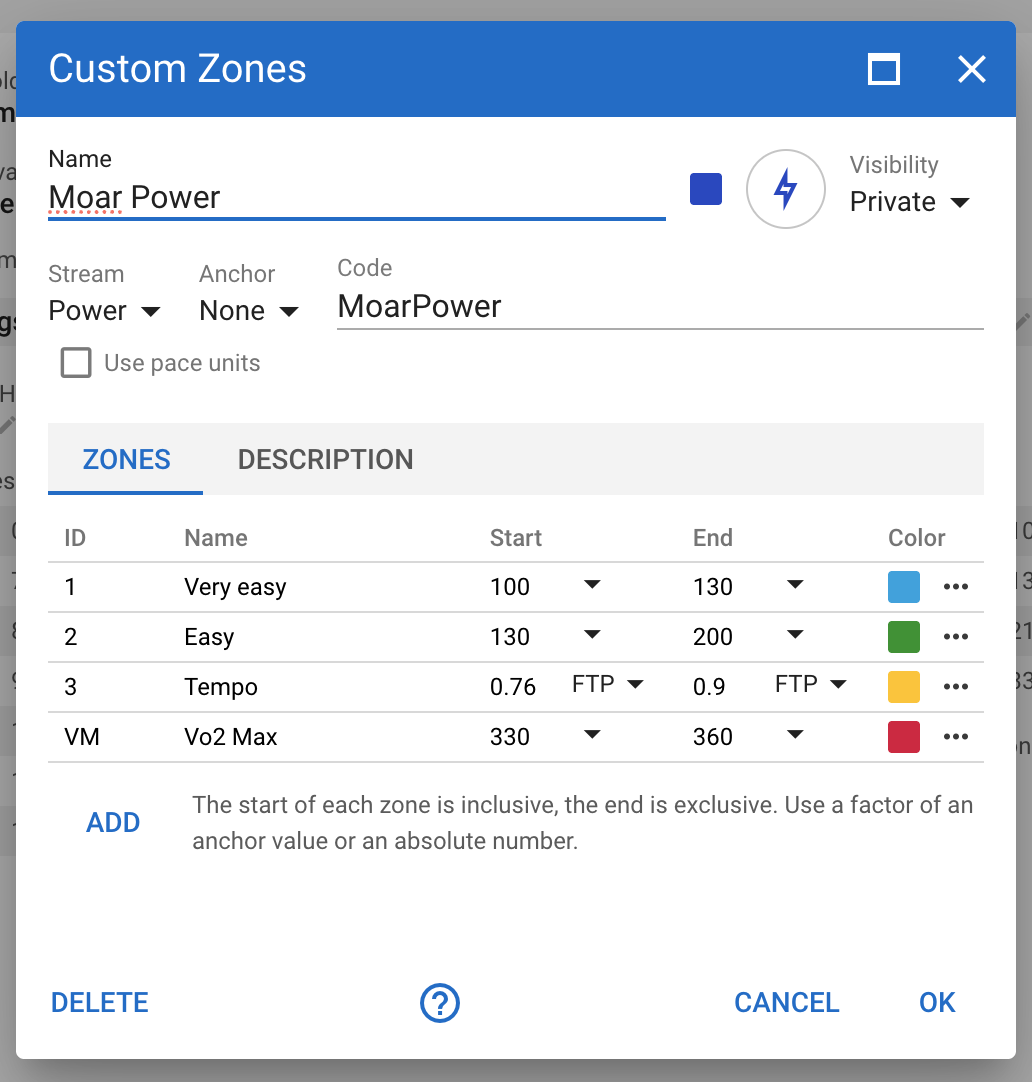
Custom Zones
Create zones for any activity stream, not just power, HR, and pace. Anchor zones to FTP, LTHR, or your own custom fields. Use custom zones for workout prescription, time-in-zone analysis, and tracking zone changes over time.
Learn more →