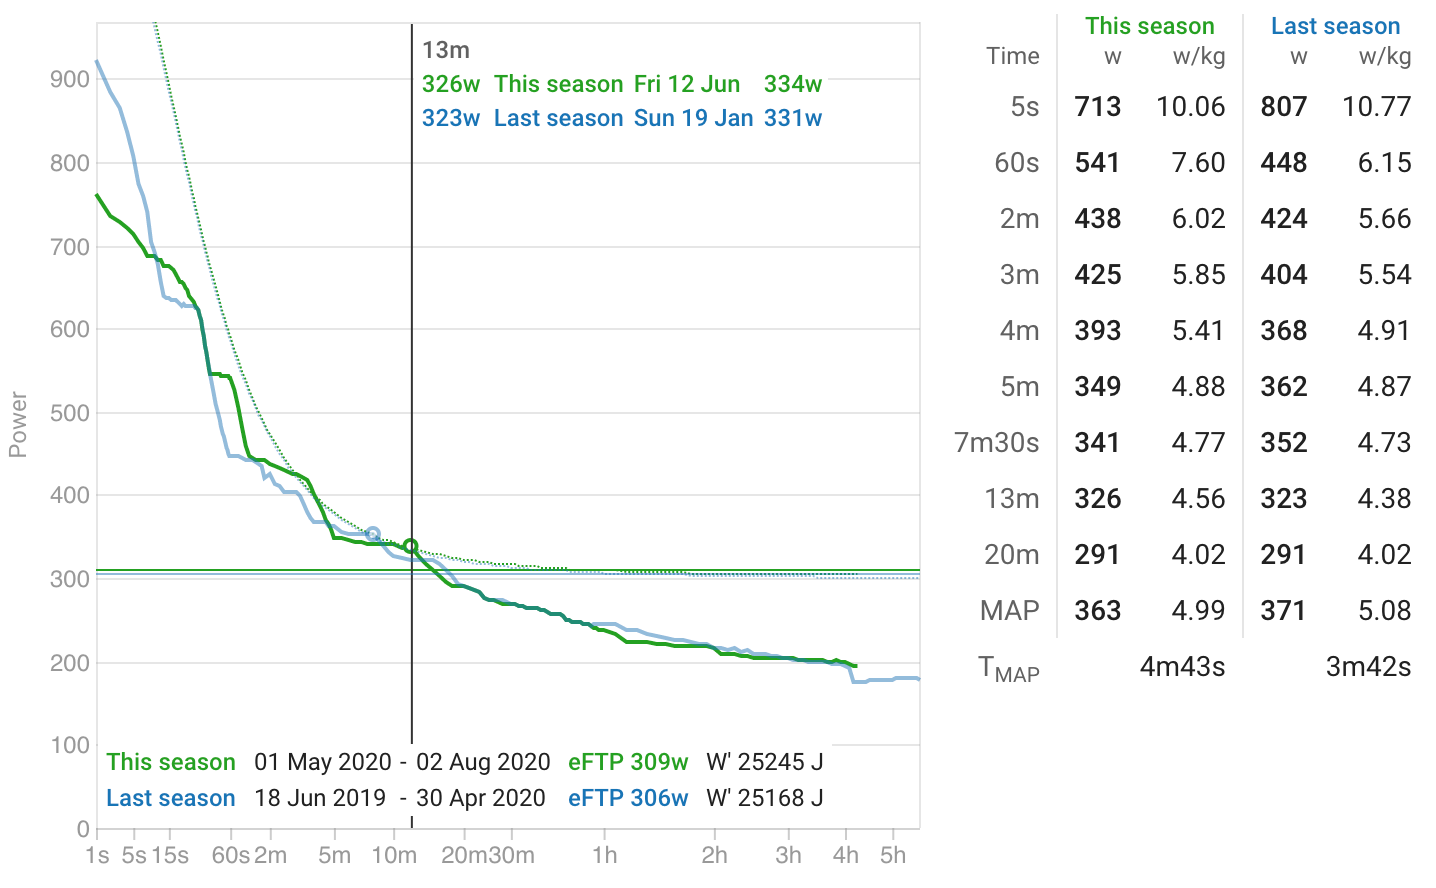
Power Curve Chart
Compare your power curve across seasons, view watts per kilogram, and estimate your MAP. Multiple modelling algorithms including eFTP, Morton's 3P, and Monod & Scherrer help you understand your strengths.
Understand Your Power Profile
The power duration curve reveals your strengths and weaknesses across all effort durations. Compare seasons, track progress, and model your capabilities.
- Season-by-season comparisons
- Watts/kg and absolute power views
- MAP (Maximal Aerobic Power) calculation
- Multiple modelling: eFTP, Morton's 3P, Monod & Scherrer
- Sub-maximal effort analysis
More in Track Your Progress
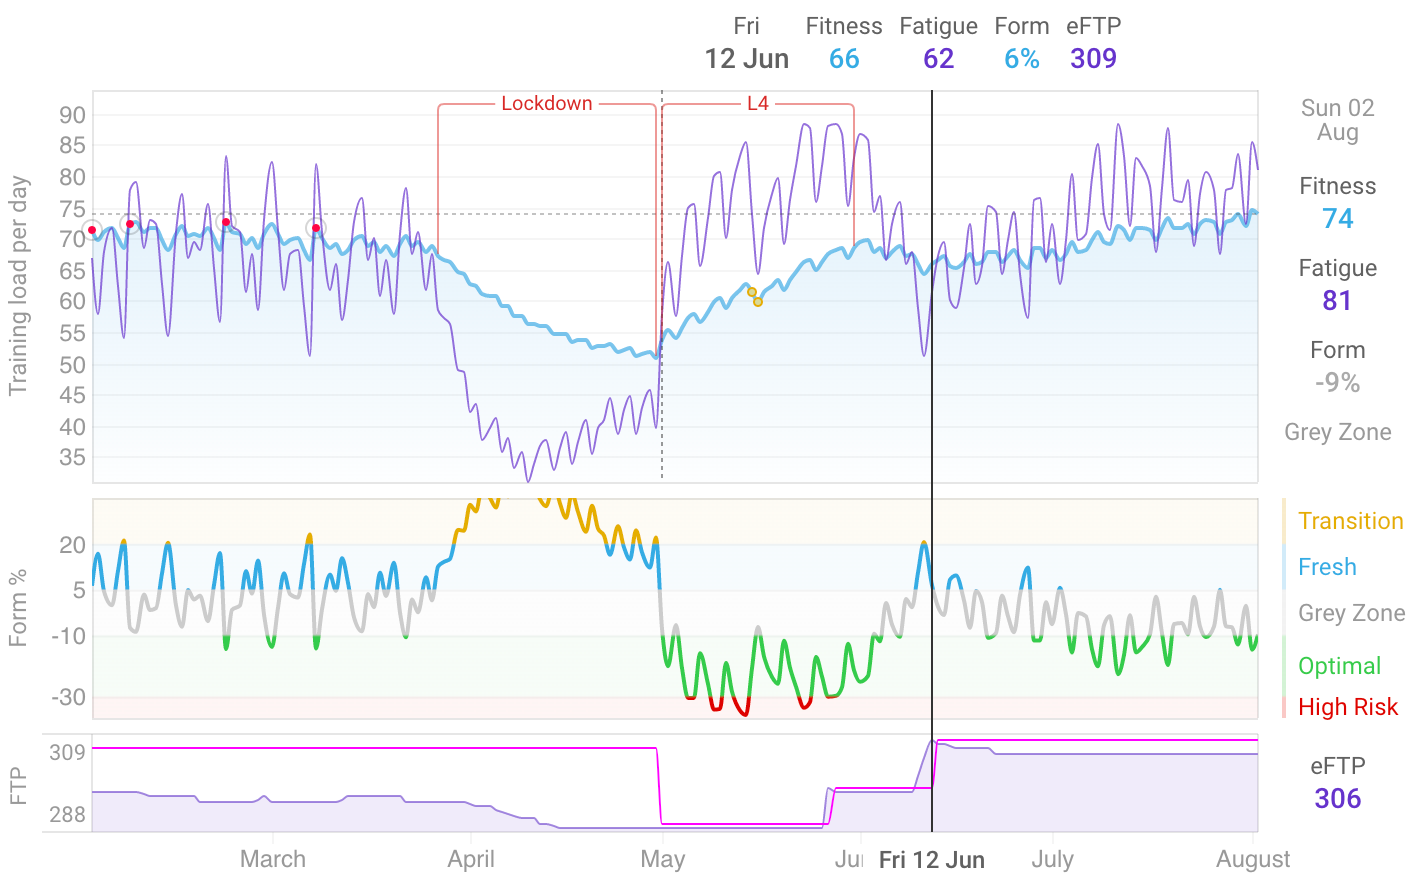
Fitness Chart
Track your long-term fitness progression with the classic Performance Management Chart. Download historical data from Strava, Garmin, and more to see your complete training history. Automatic eFTP estimation from single maximal efforts keeps your zones up to date.
Learn more →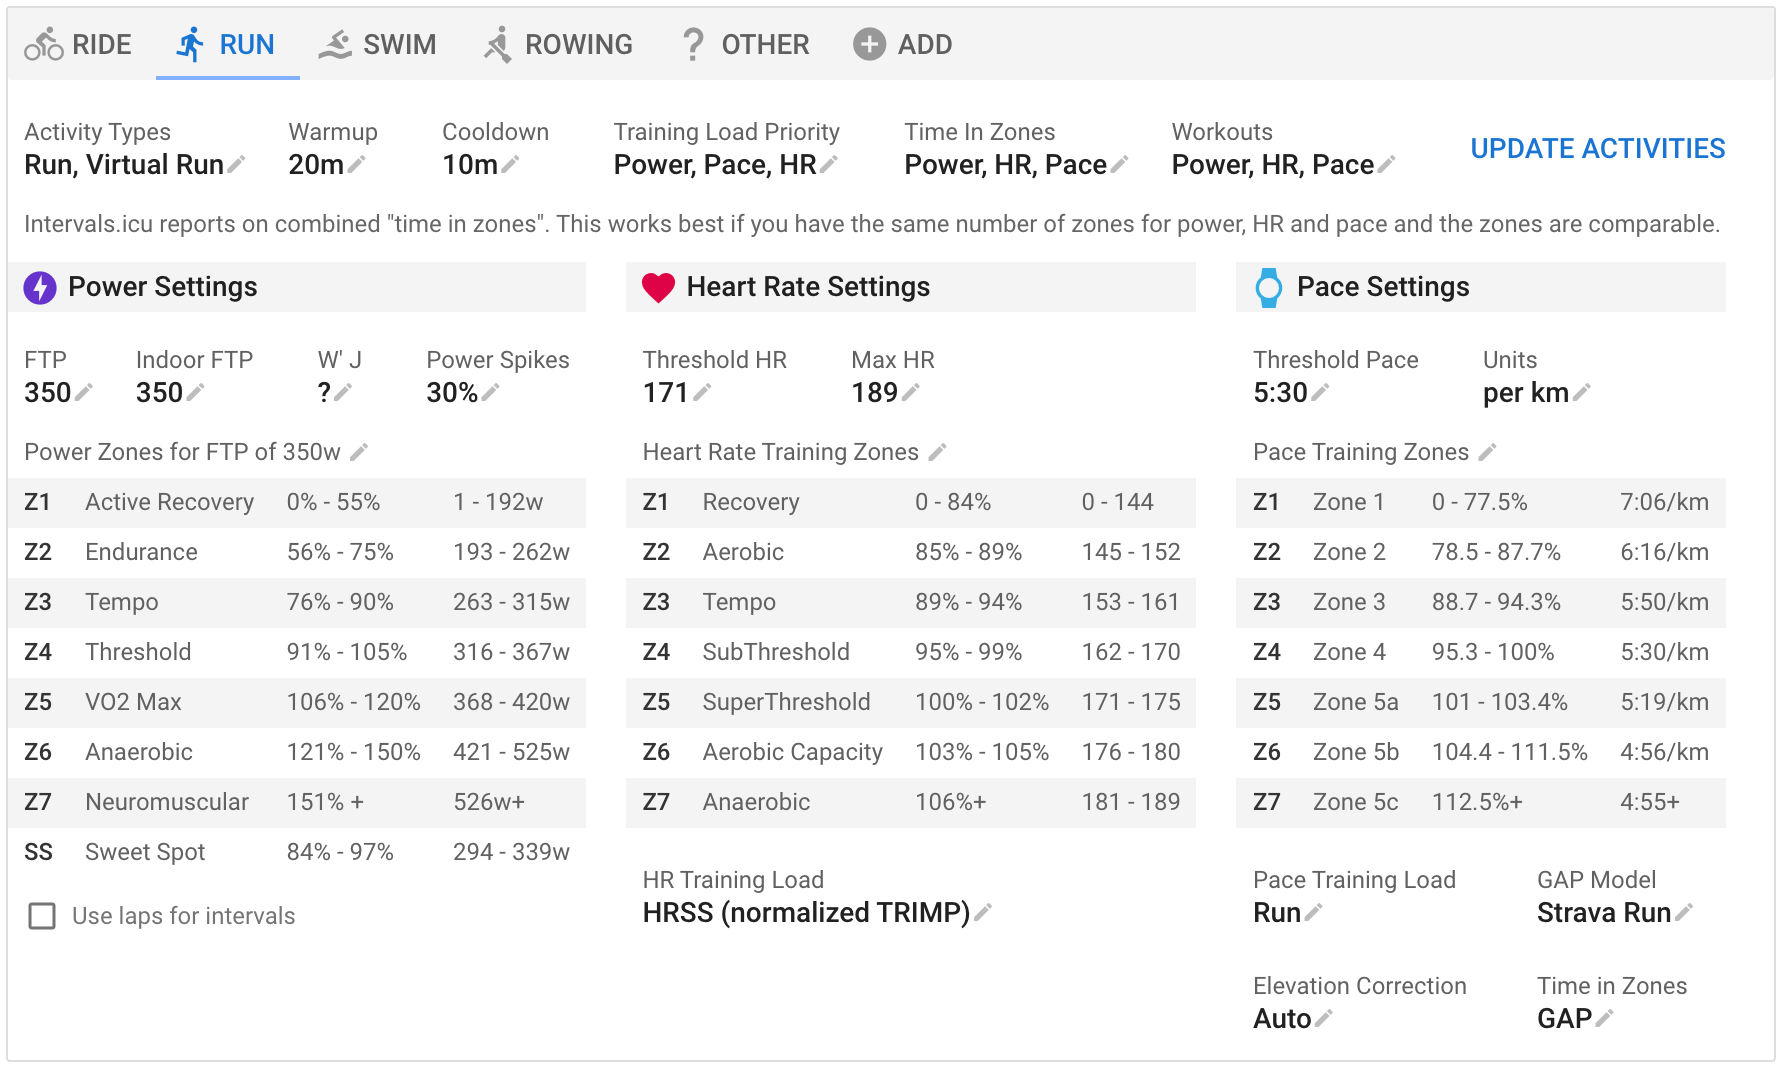
Multisport
Separate zones and settings per sport. Whether you ride, run, swim, row or do all four, Intervals.icu tracks each discipline independently with appropriate metrics and calculations.
Learn more →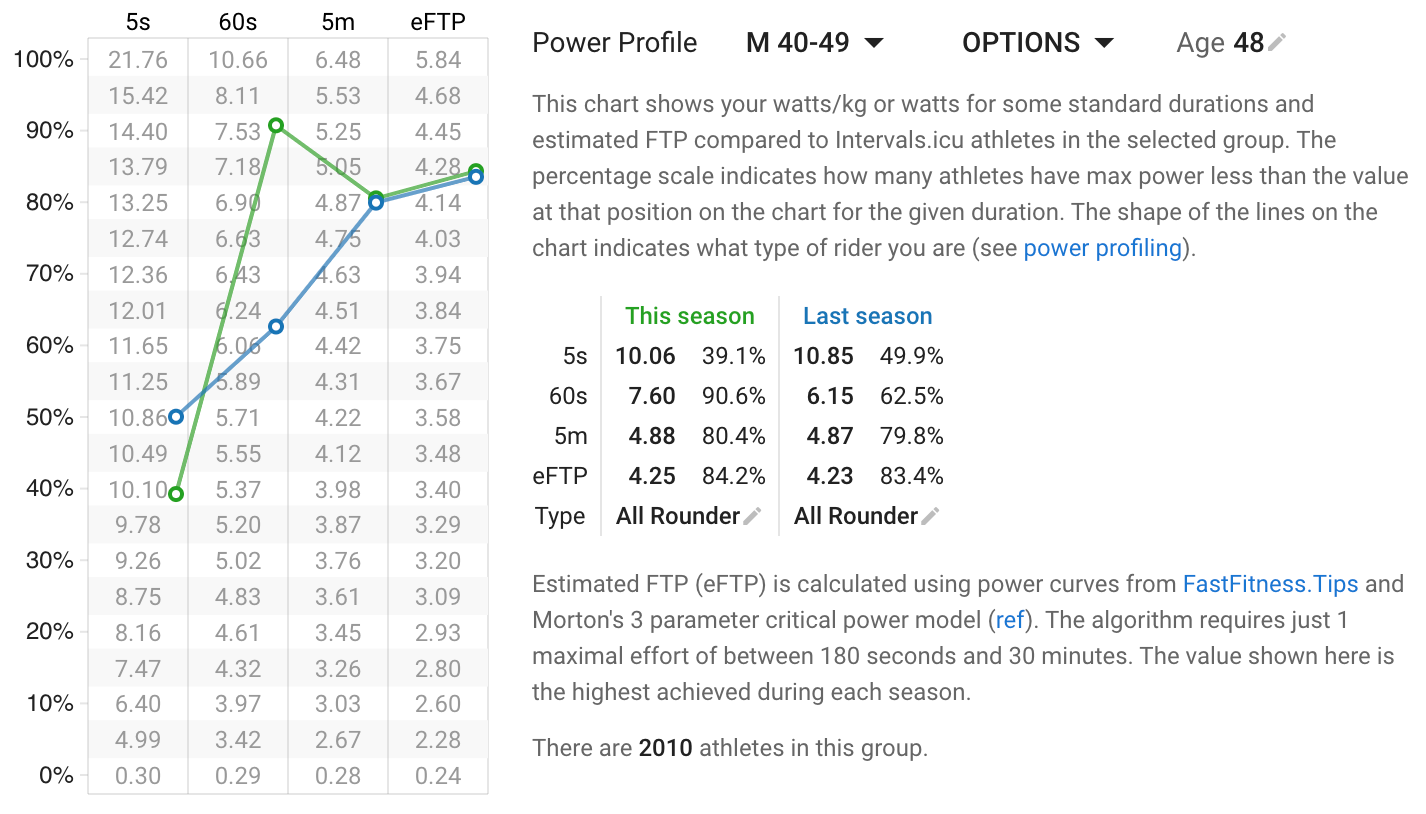
Power Rankings
See how your power compares to other athletes in your age group. View rankings by watts per kilogram and absolute watts to understand where you stand.
Learn more →