Custom Activity Charts
Create your own activity charts using JavaScript and Plotly. Access power, heart rate, pace, streams, intervals, power curves and more. Share your charts with the community.
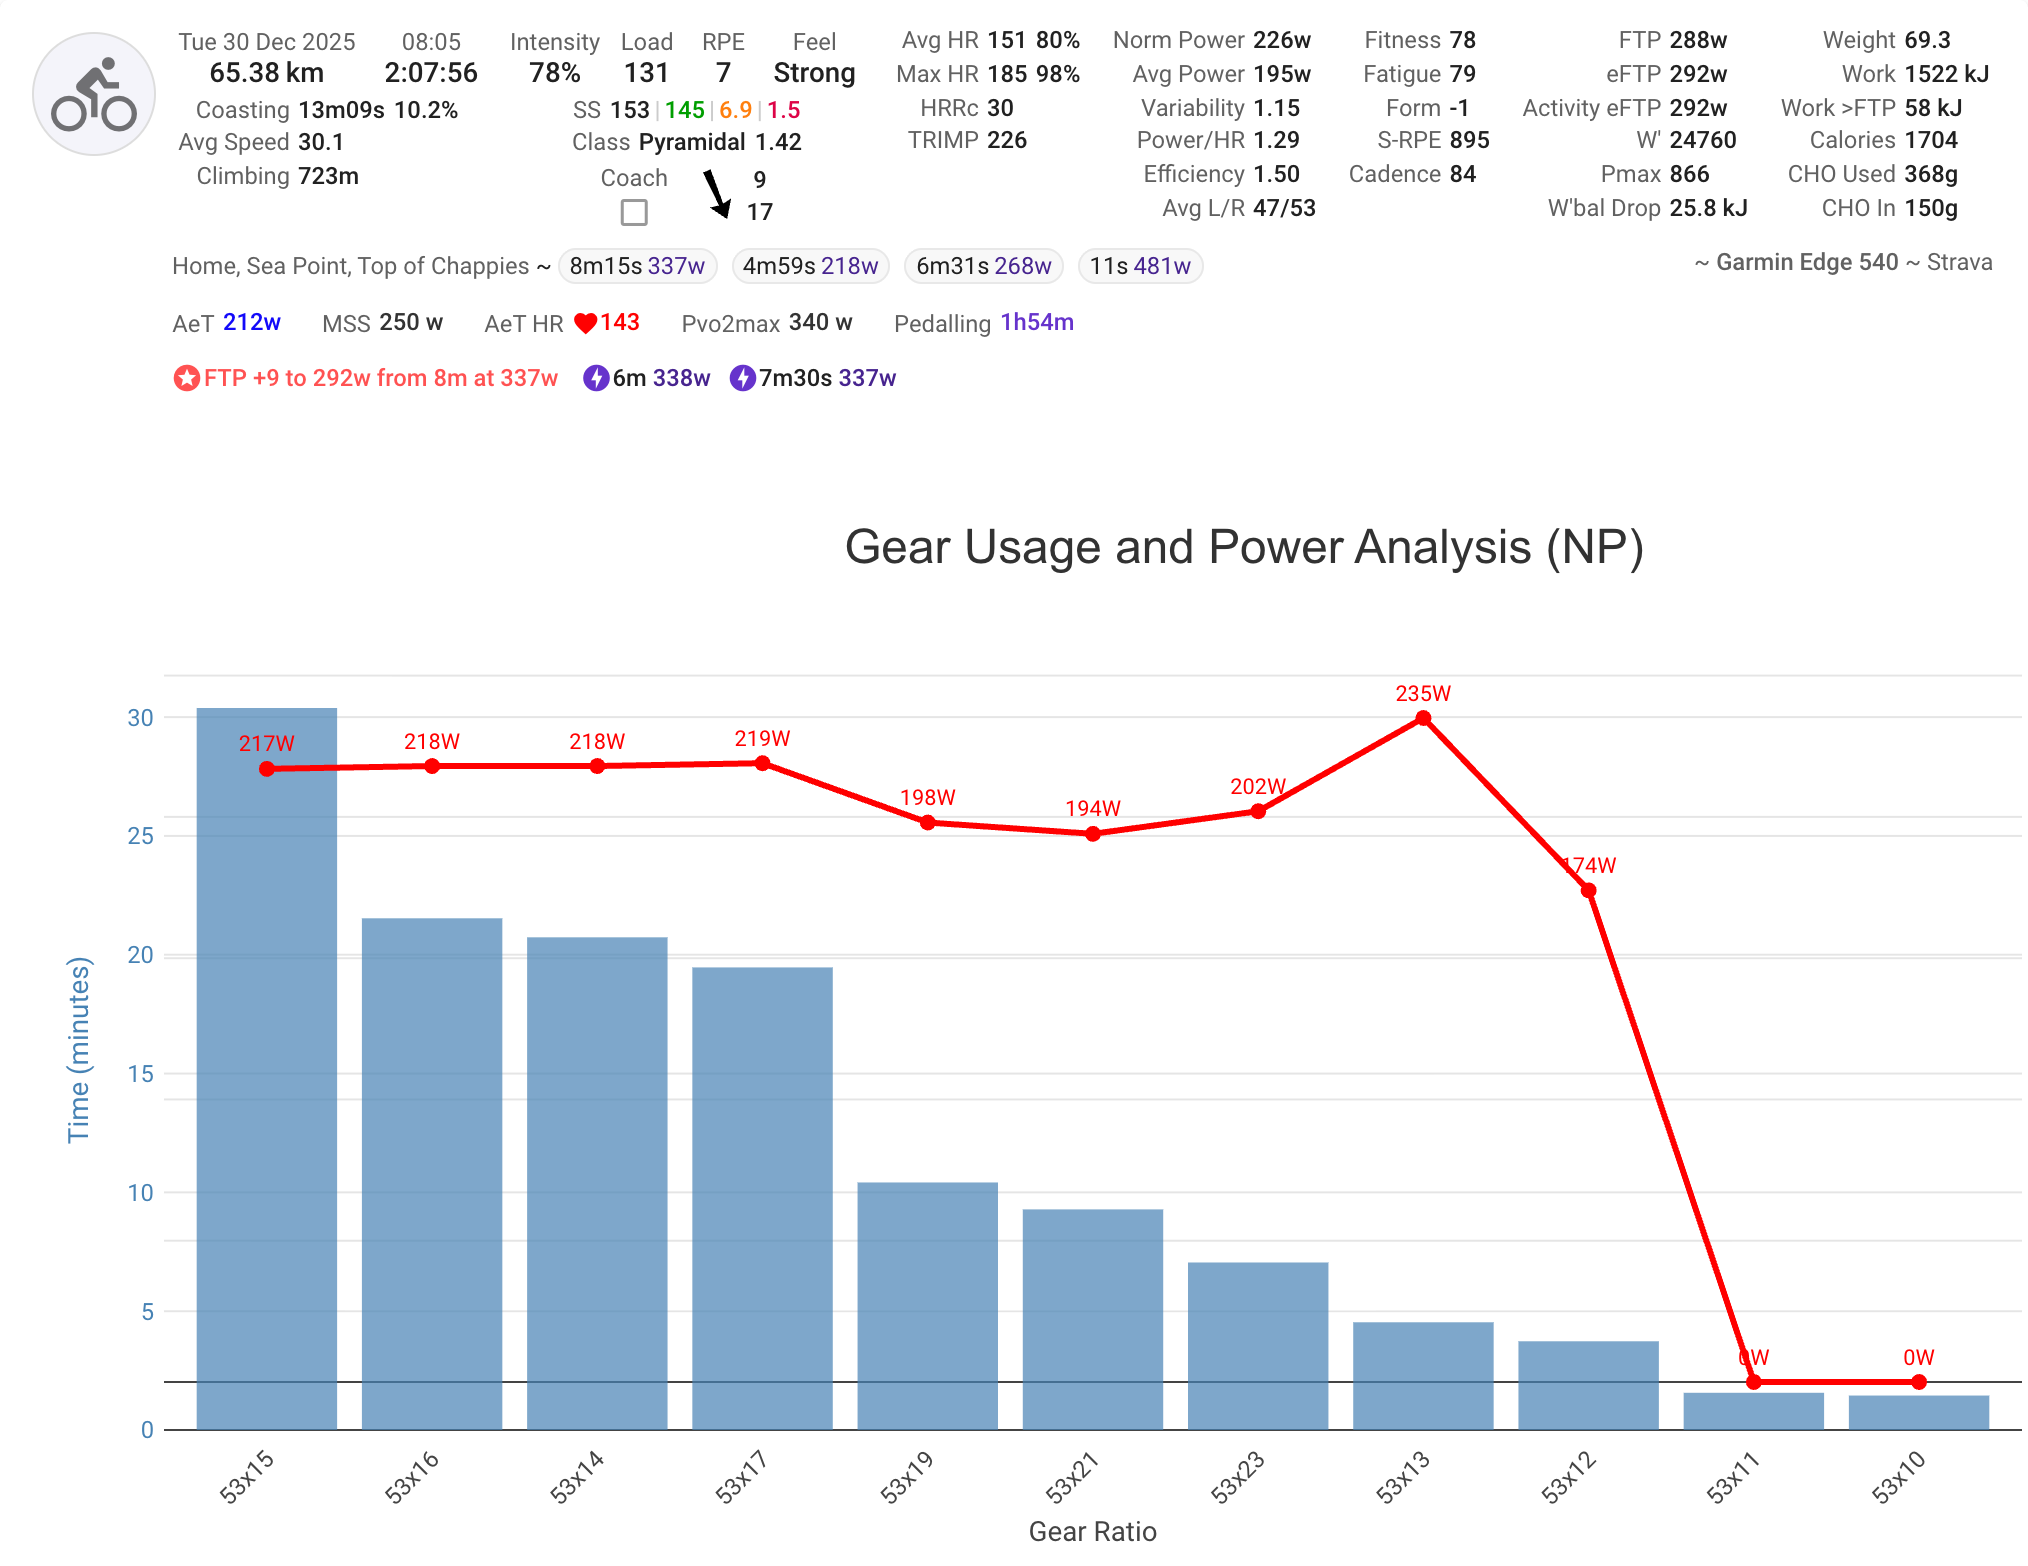
Build Any Chart You Can Imagine
Custom Activity Charts let you create personalized visualizations on your activity pages using JavaScript and the Plotly charting library. If you can think of it, you can chart it.
- Create scatter plots, line charts, bar graphs and more with Plotly
- Access activity streams: power, heart rate, pace, cadence and more
- Use power curves, HR duration curves, pace curves and fatigued variants
- Access interval data with average power, speed, HR and other metrics
- Access athlete settings, sport settings and wellness records
- Charts are stored per sport
- Share charts with the community and discover charts shared by others
More in Analyze Your Activities
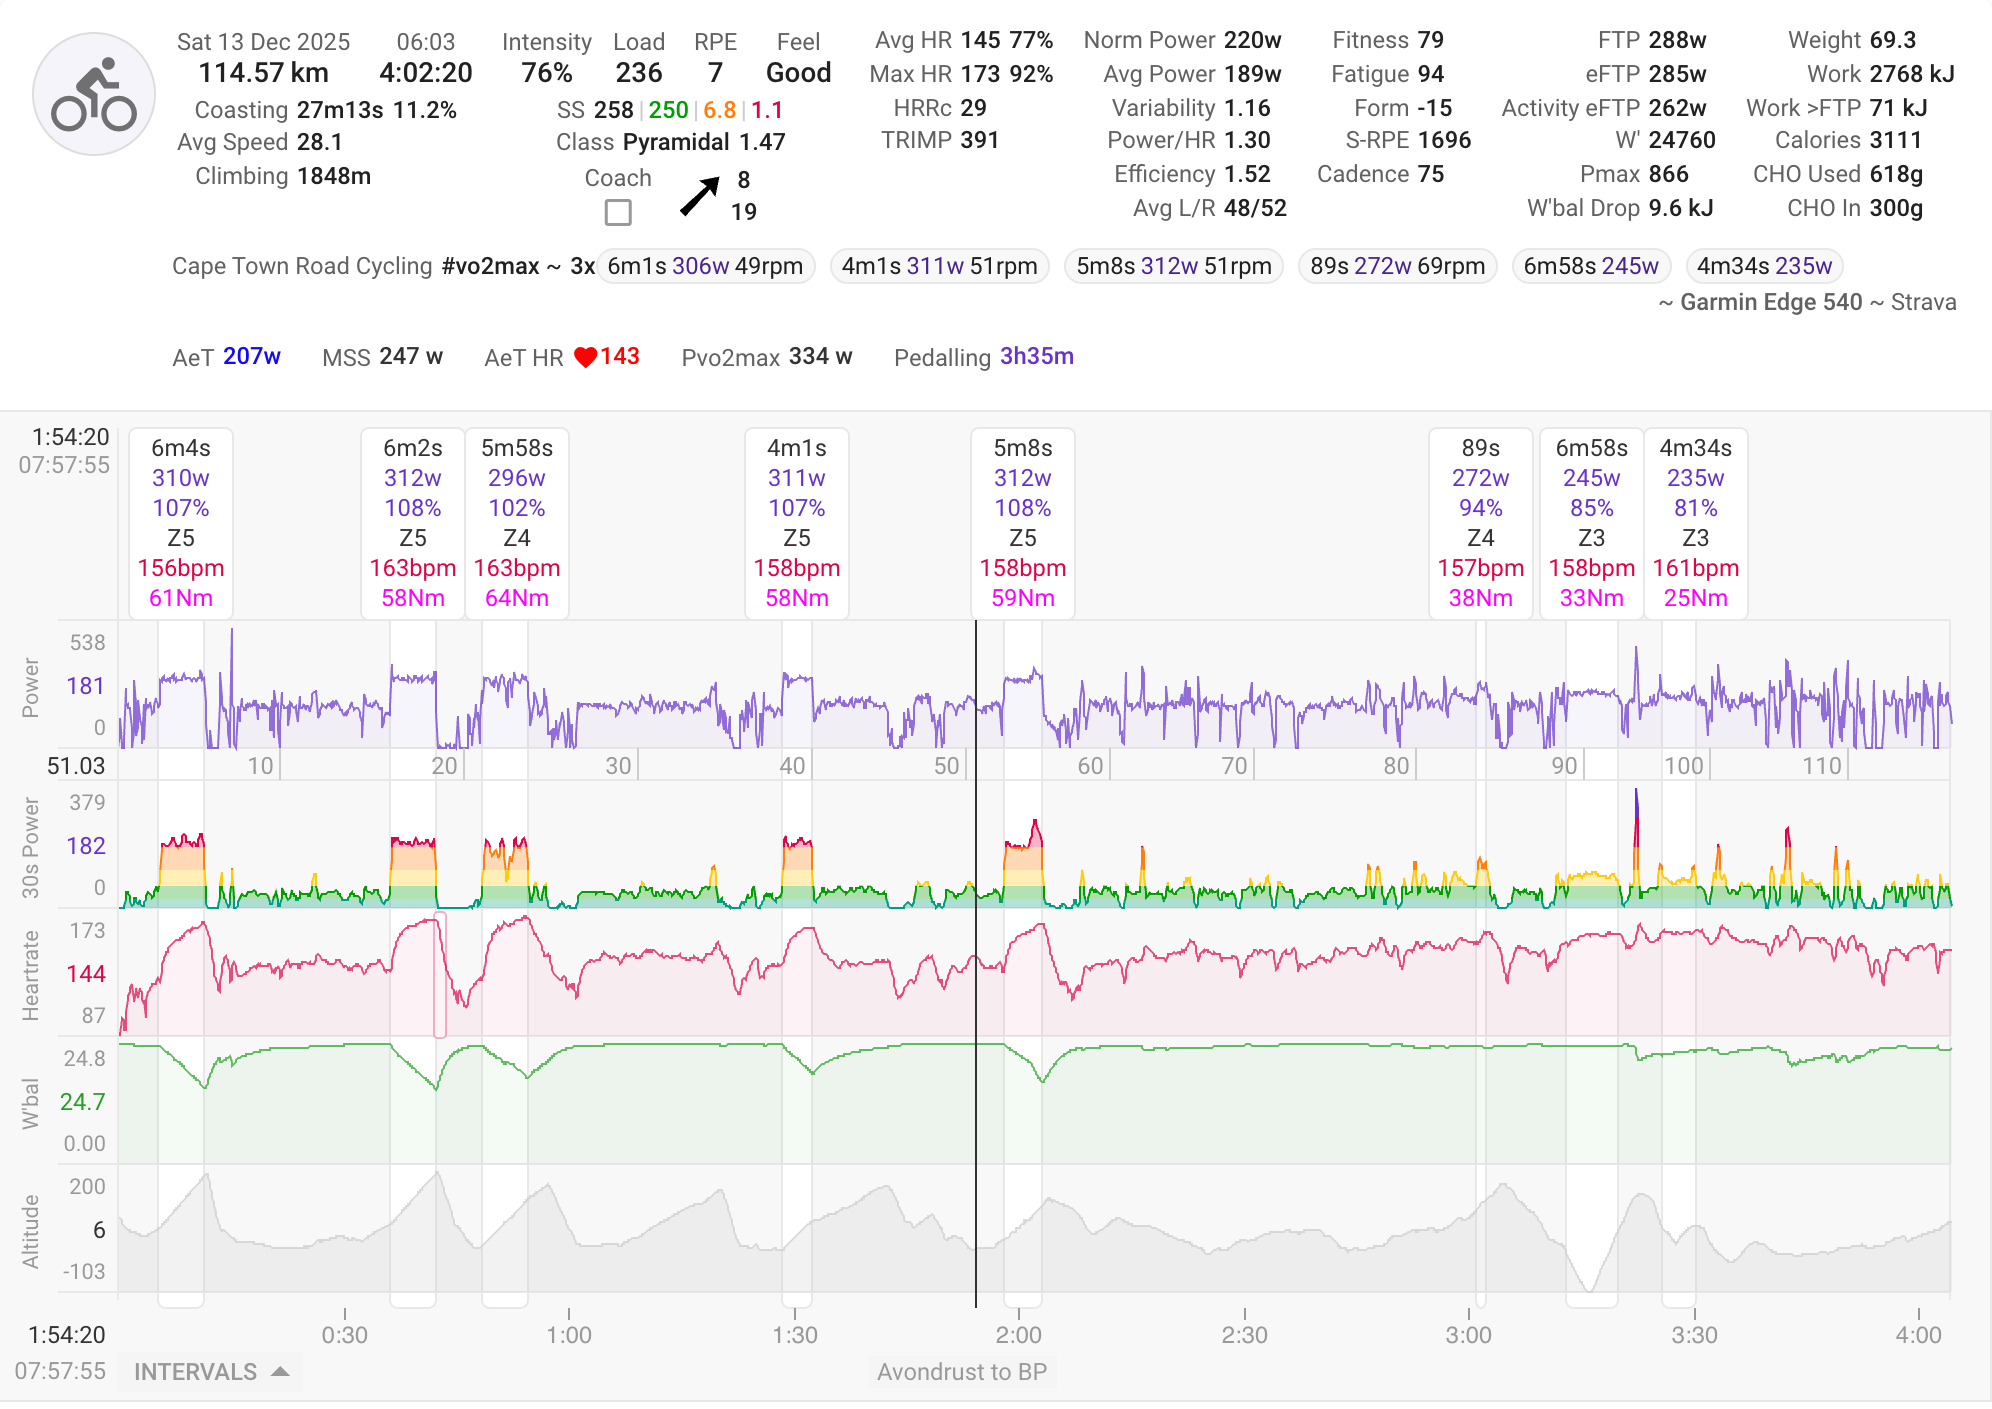
Activity Timeline
View your activity with Coggan metrics plus unique Intervals.icu metrics. Automatic interval detection finds your efforts, with spike detection and correction for power and HR data.
Learn more →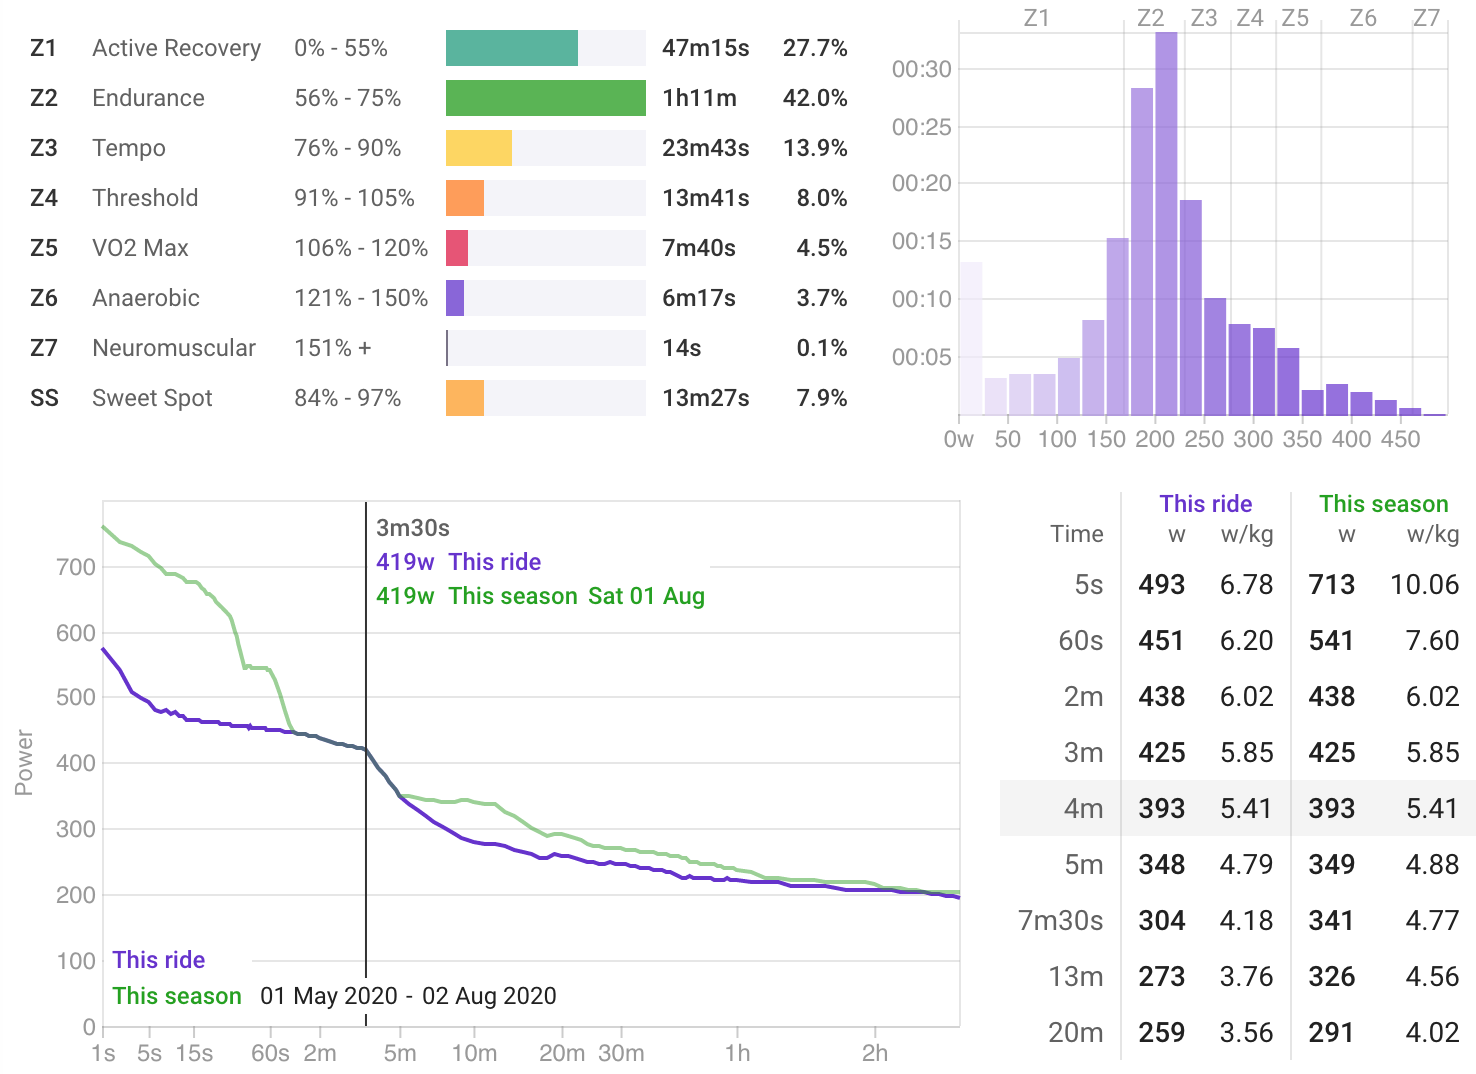
Power Charts
Analyze zone time distribution, view your 42-day power curve, histograms, and best efforts all within the context of a single activity.
Learn more →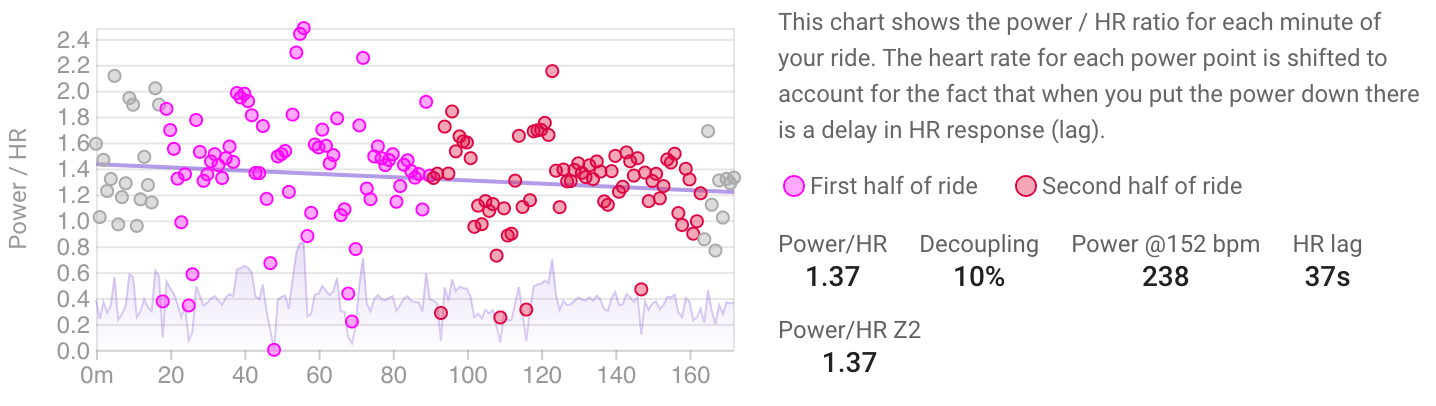
Decoupling
Track your aerobic fitness through cardiac drift analysis. The Power/HR Z2 metric provides a clear picture of your aerobic efficiency over time.
Learn more →