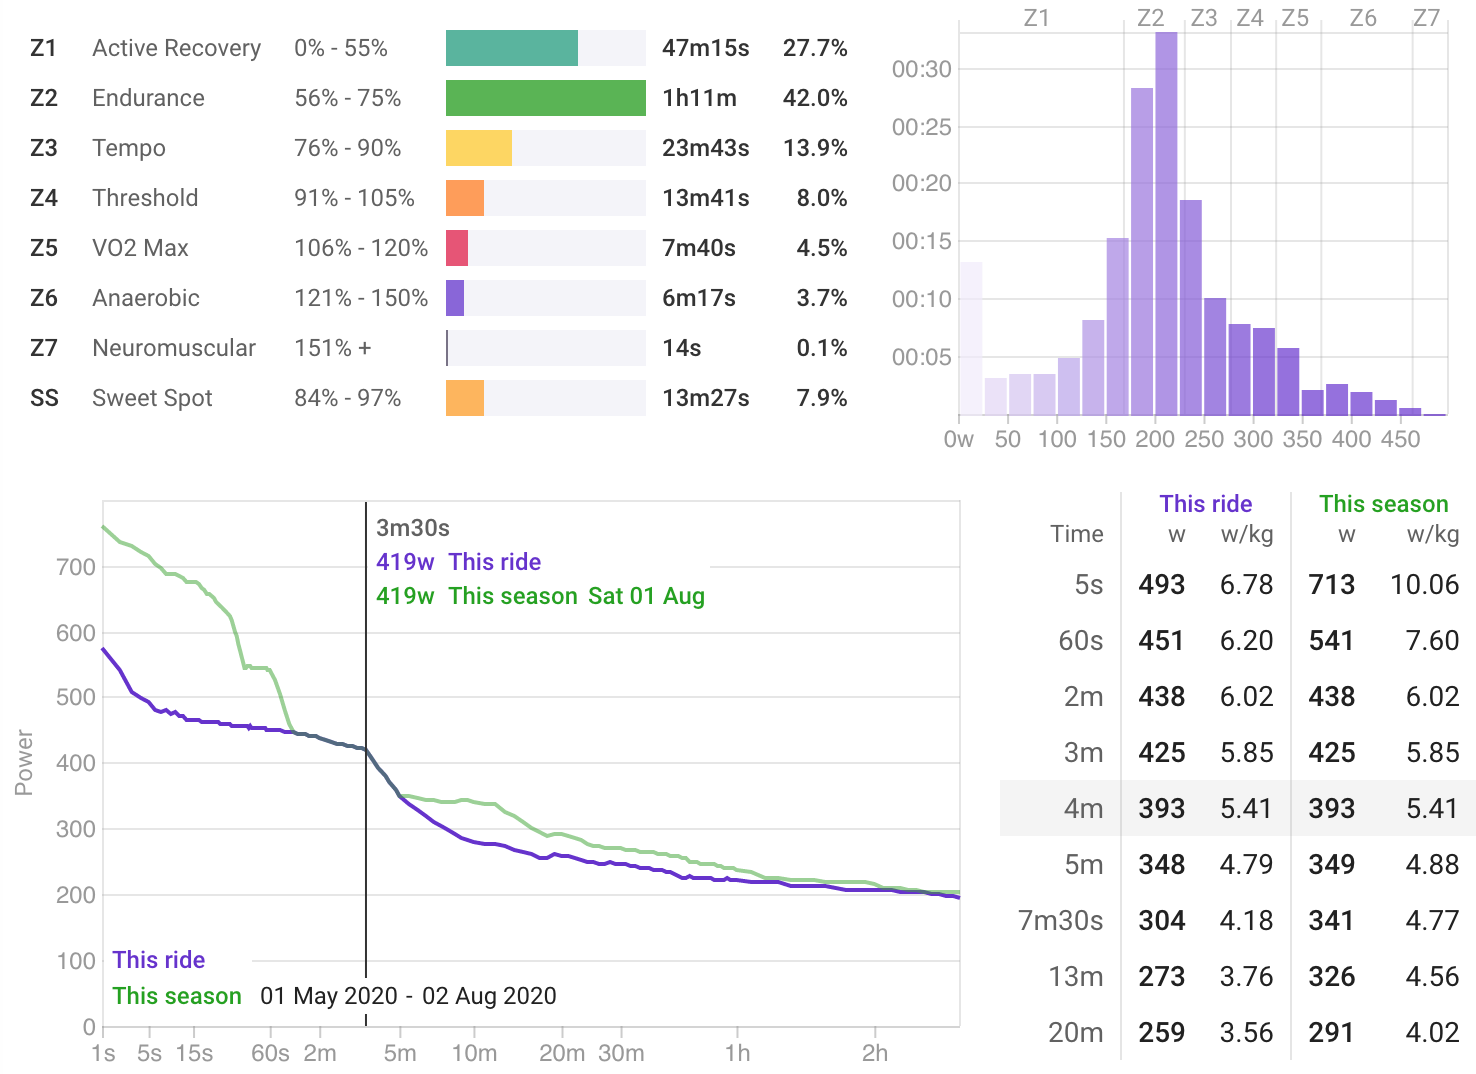
Activity Power Charts
Analyze zone time distribution, view your 42-day power curve, histograms, and best efforts all within the context of a single activity.
Power Analysis In Depth
Understand the power characteristics of each activity with detailed zone and distribution charts.
- Rolling power curves for different durations
- Compare power curves indoor vs outdoor, different power meters, seasons
- Fatigued power/li>
- Absolute power and watts/kg/li>
- Zone time analysis
- Power histograms
- Best efforts tracking
More in Analyze Your Activities
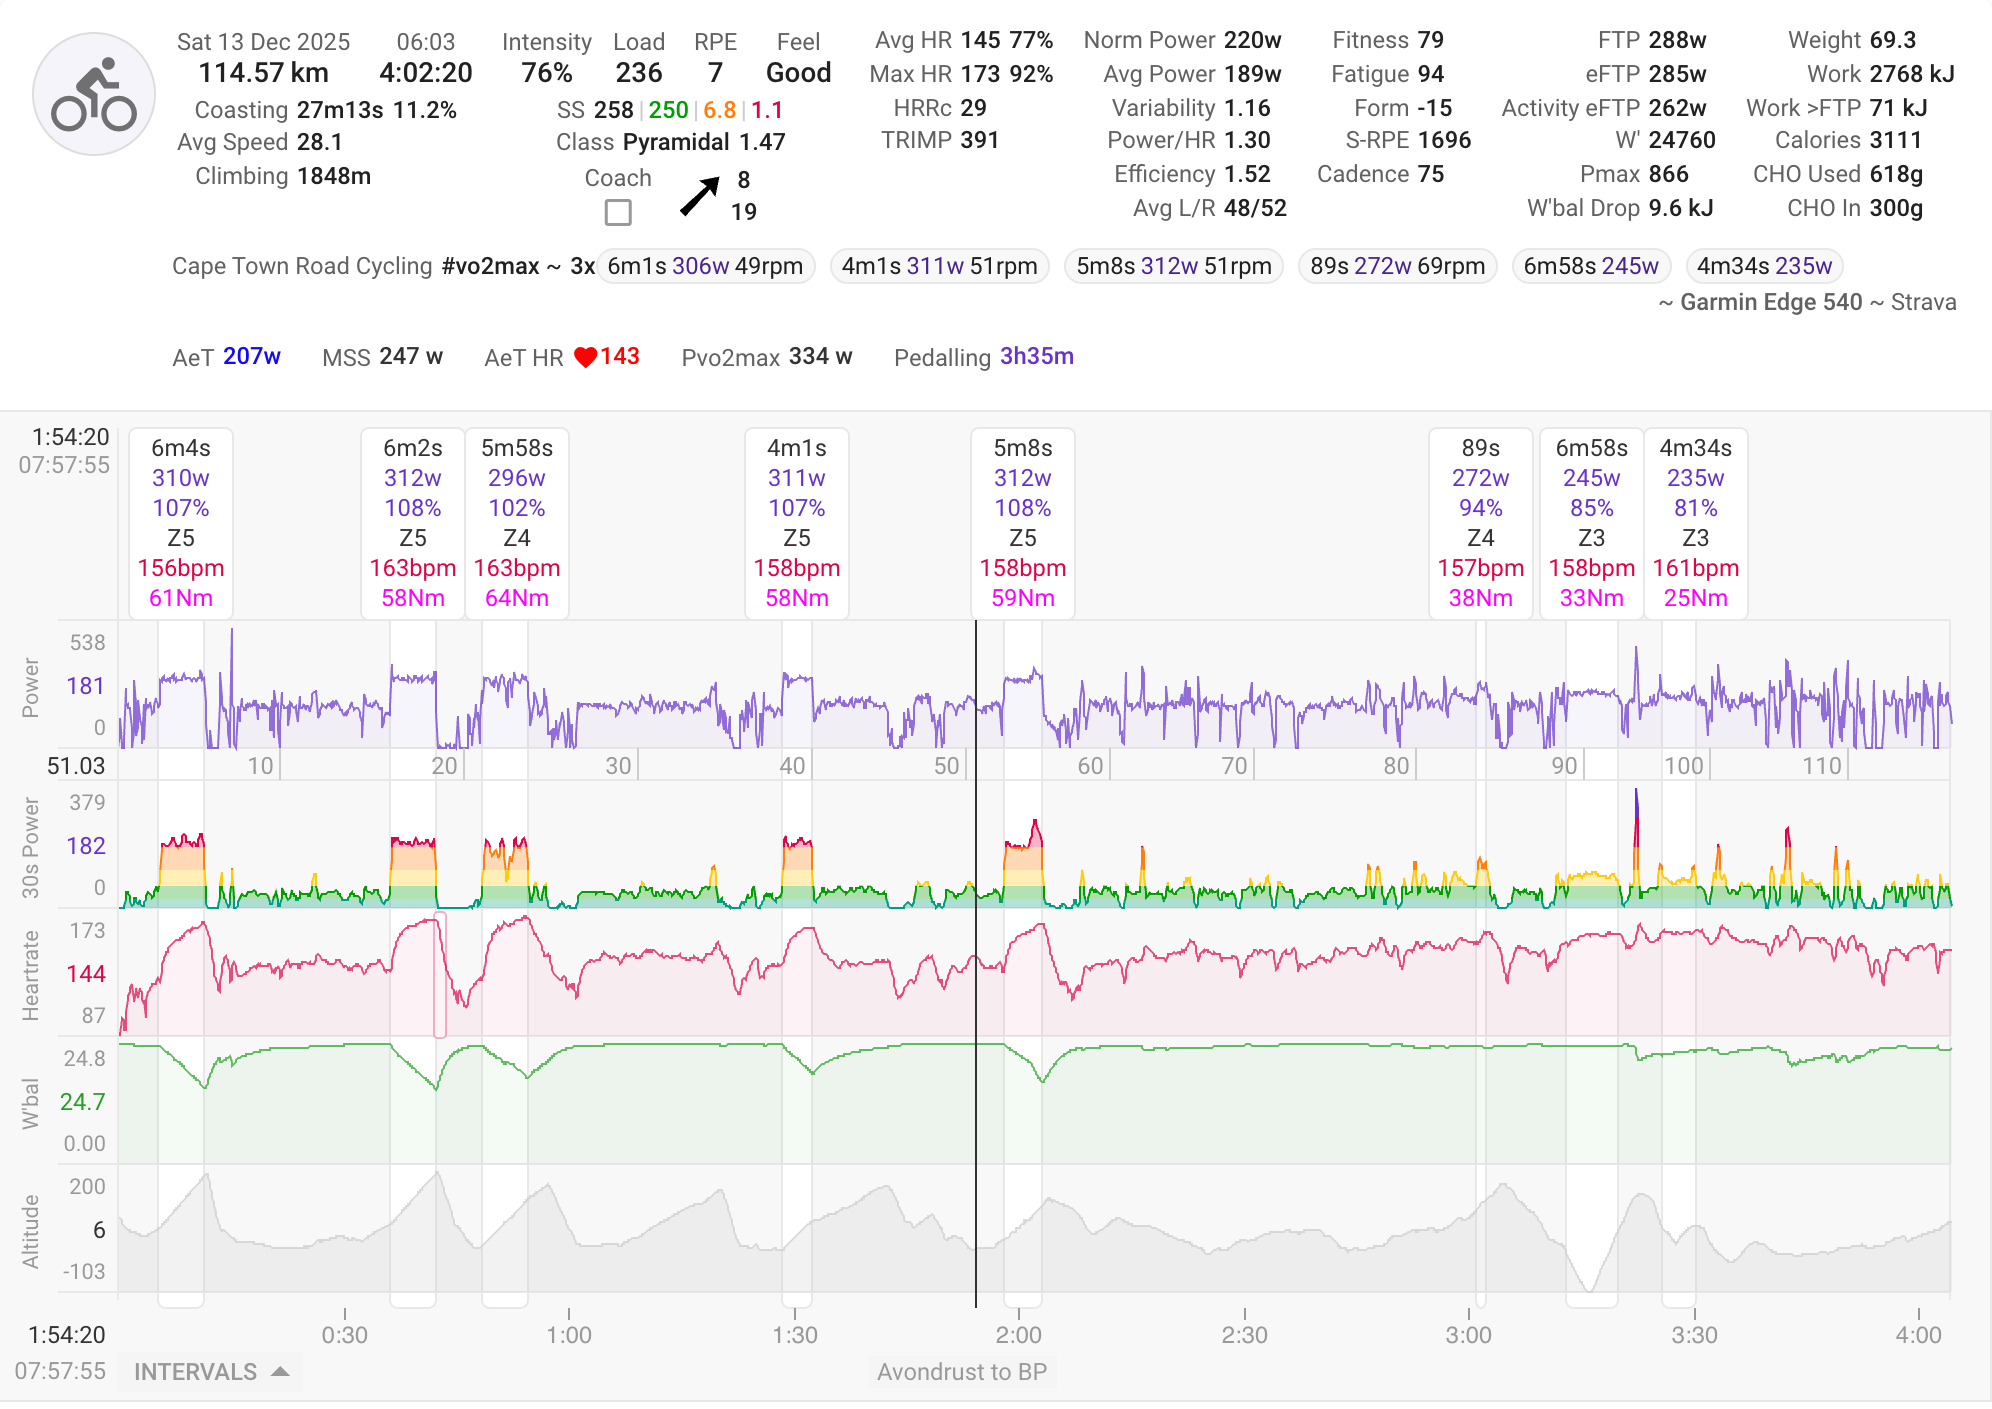
Activity Timeline
View your activity with Coggan metrics plus unique Intervals.icu metrics. Automatic interval detection finds your efforts, with spike detection and correction for power and HR data.
Learn more →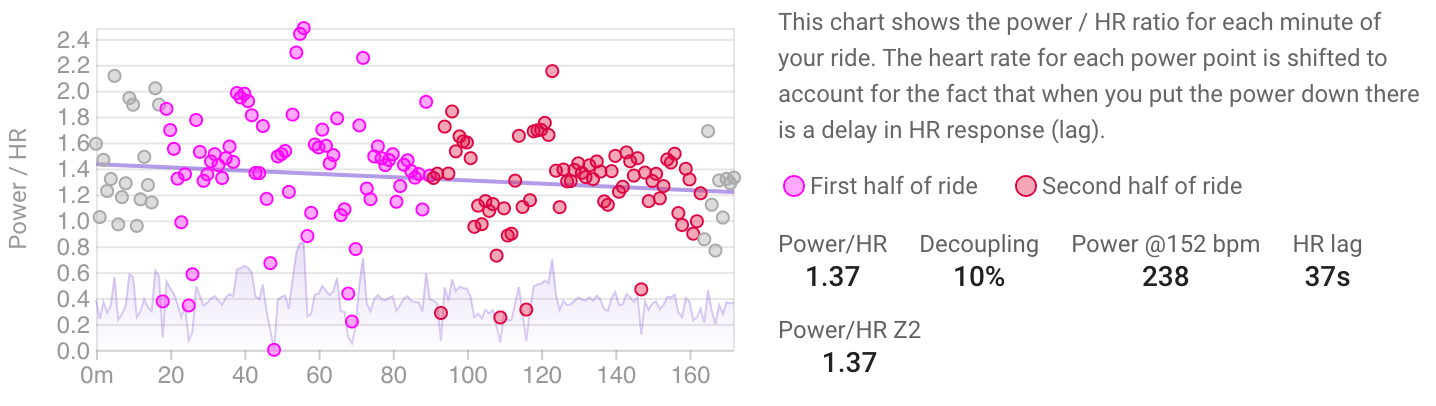
Decoupling
Track your aerobic fitness through cardiac drift analysis. The Power/HR Z2 metric provides a clear picture of your aerobic efficiency over time.
Learn more →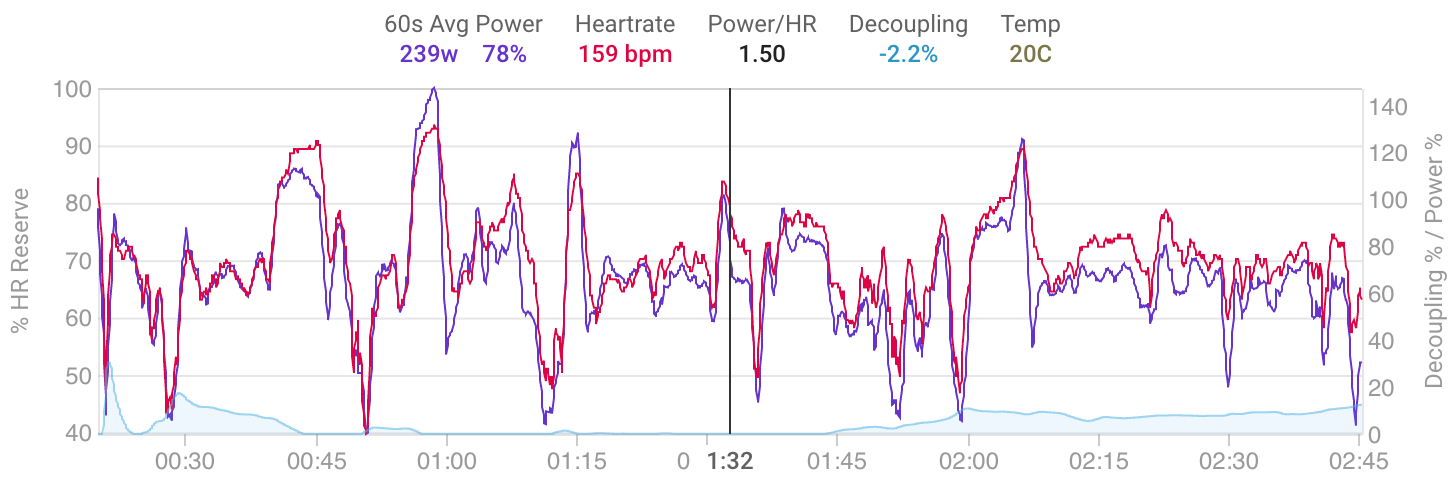
Seiler Decoupling
Analyze decoupling using 60-second moving averages with power and heart rate expressed as a percentage of reserve, inspired by Dr Stephen Seiler's research.
Learn more →