Compare Activities
Overlay activities on top of each other to track progression of interval sessions, compare different athletes, and analyze performance changes over time.
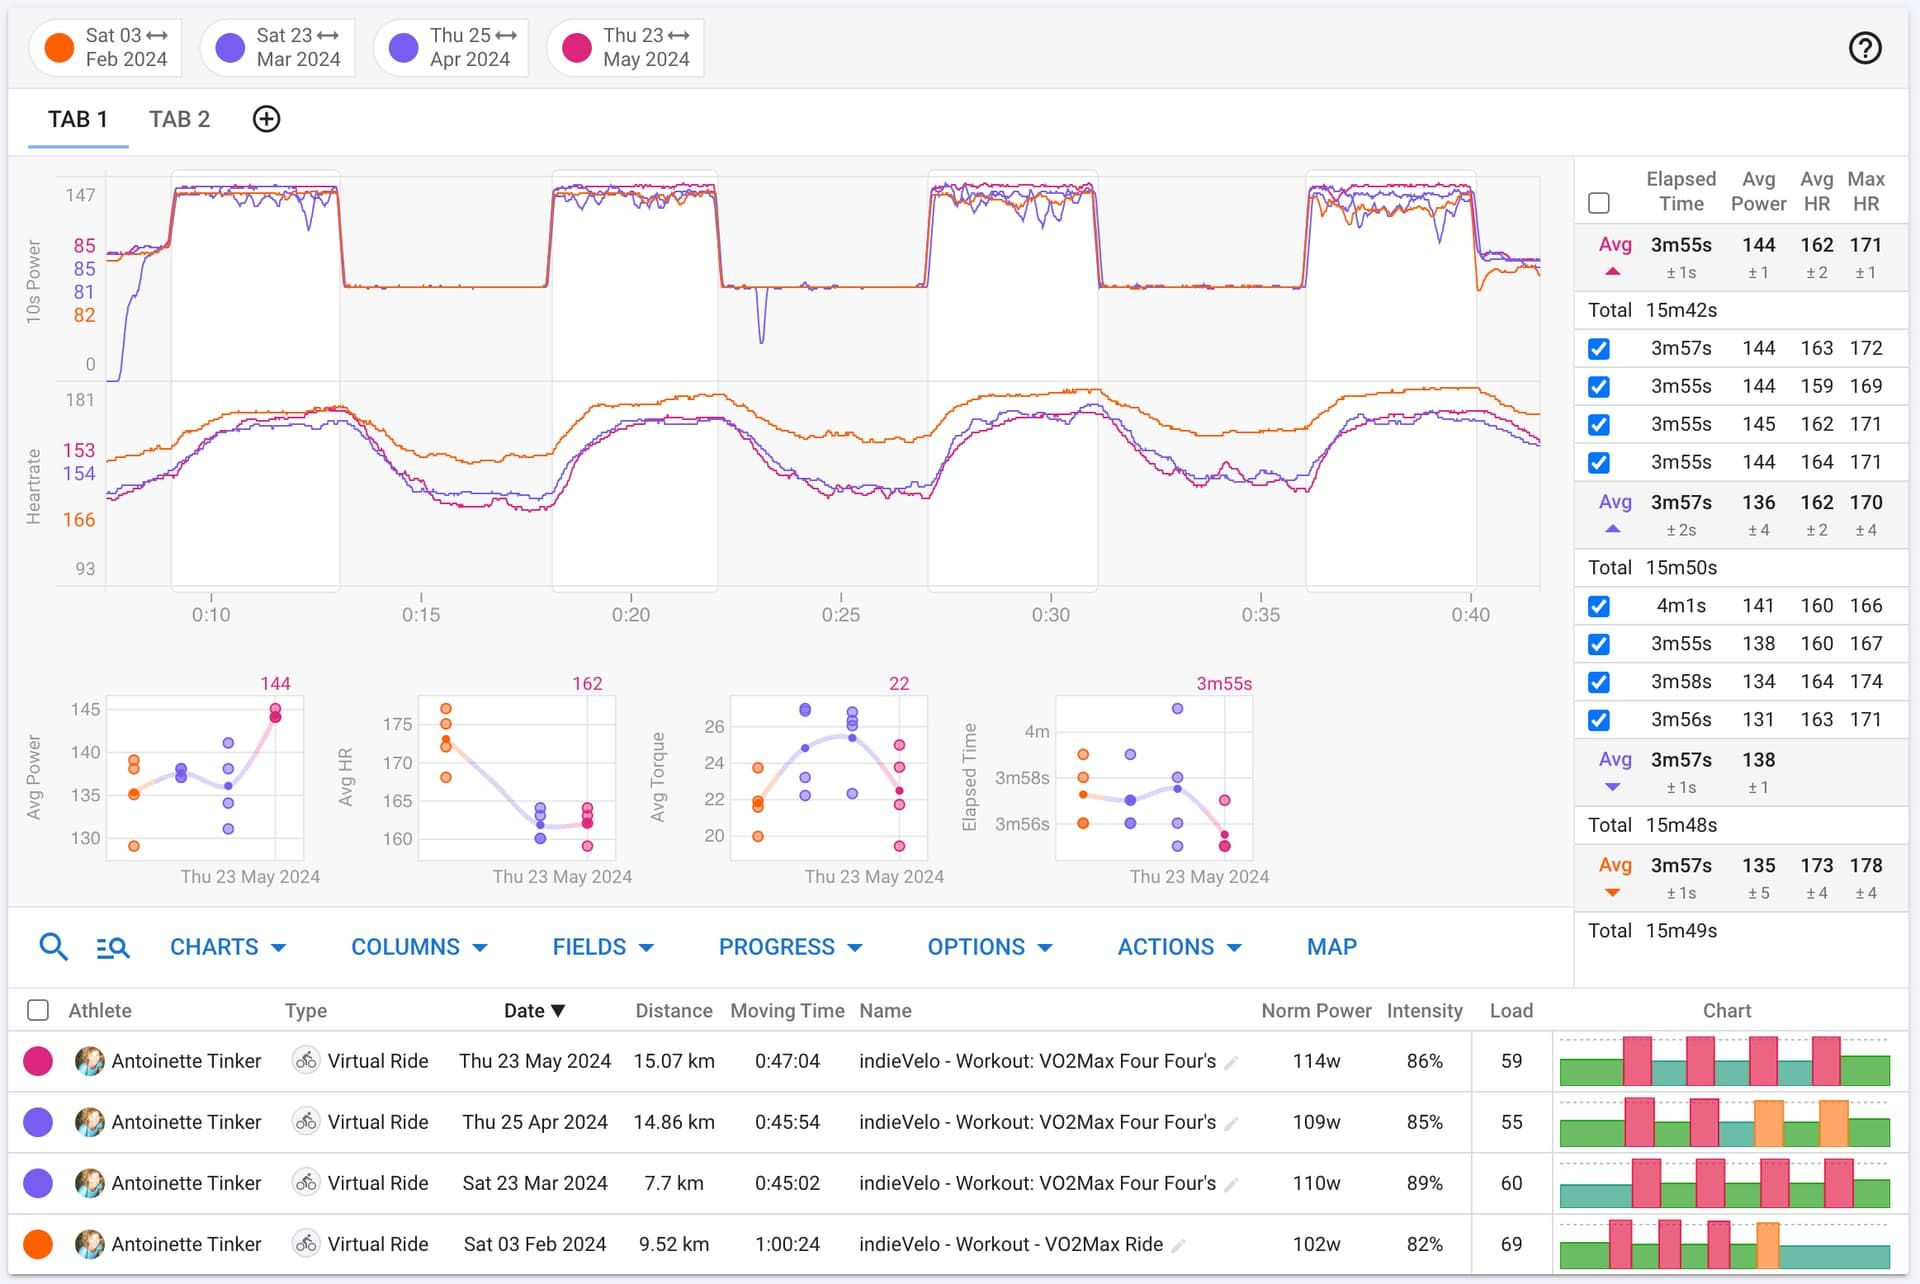
Side-by-Side Activity Analysis
The Compare Activities page lets you overlay activities to see how your performance has changed over time or how you stack up against other athletes.
- Overlay power, heart rate, and other traces from multiple activities
- Compare activities from different athletes
- Toggle between time and distance on the x-axis
- Shift activity traces to align intervals for direct comparison
- Search by activity name, hashtag, or interval intensity and duration
- Progress charts to track metrics like average power and HR across sessions
- Multiple tabs for organizing different comparison sets
- Save and retrieve comparisons for later
- Map display for route visualization
More in Analyze Your Activities
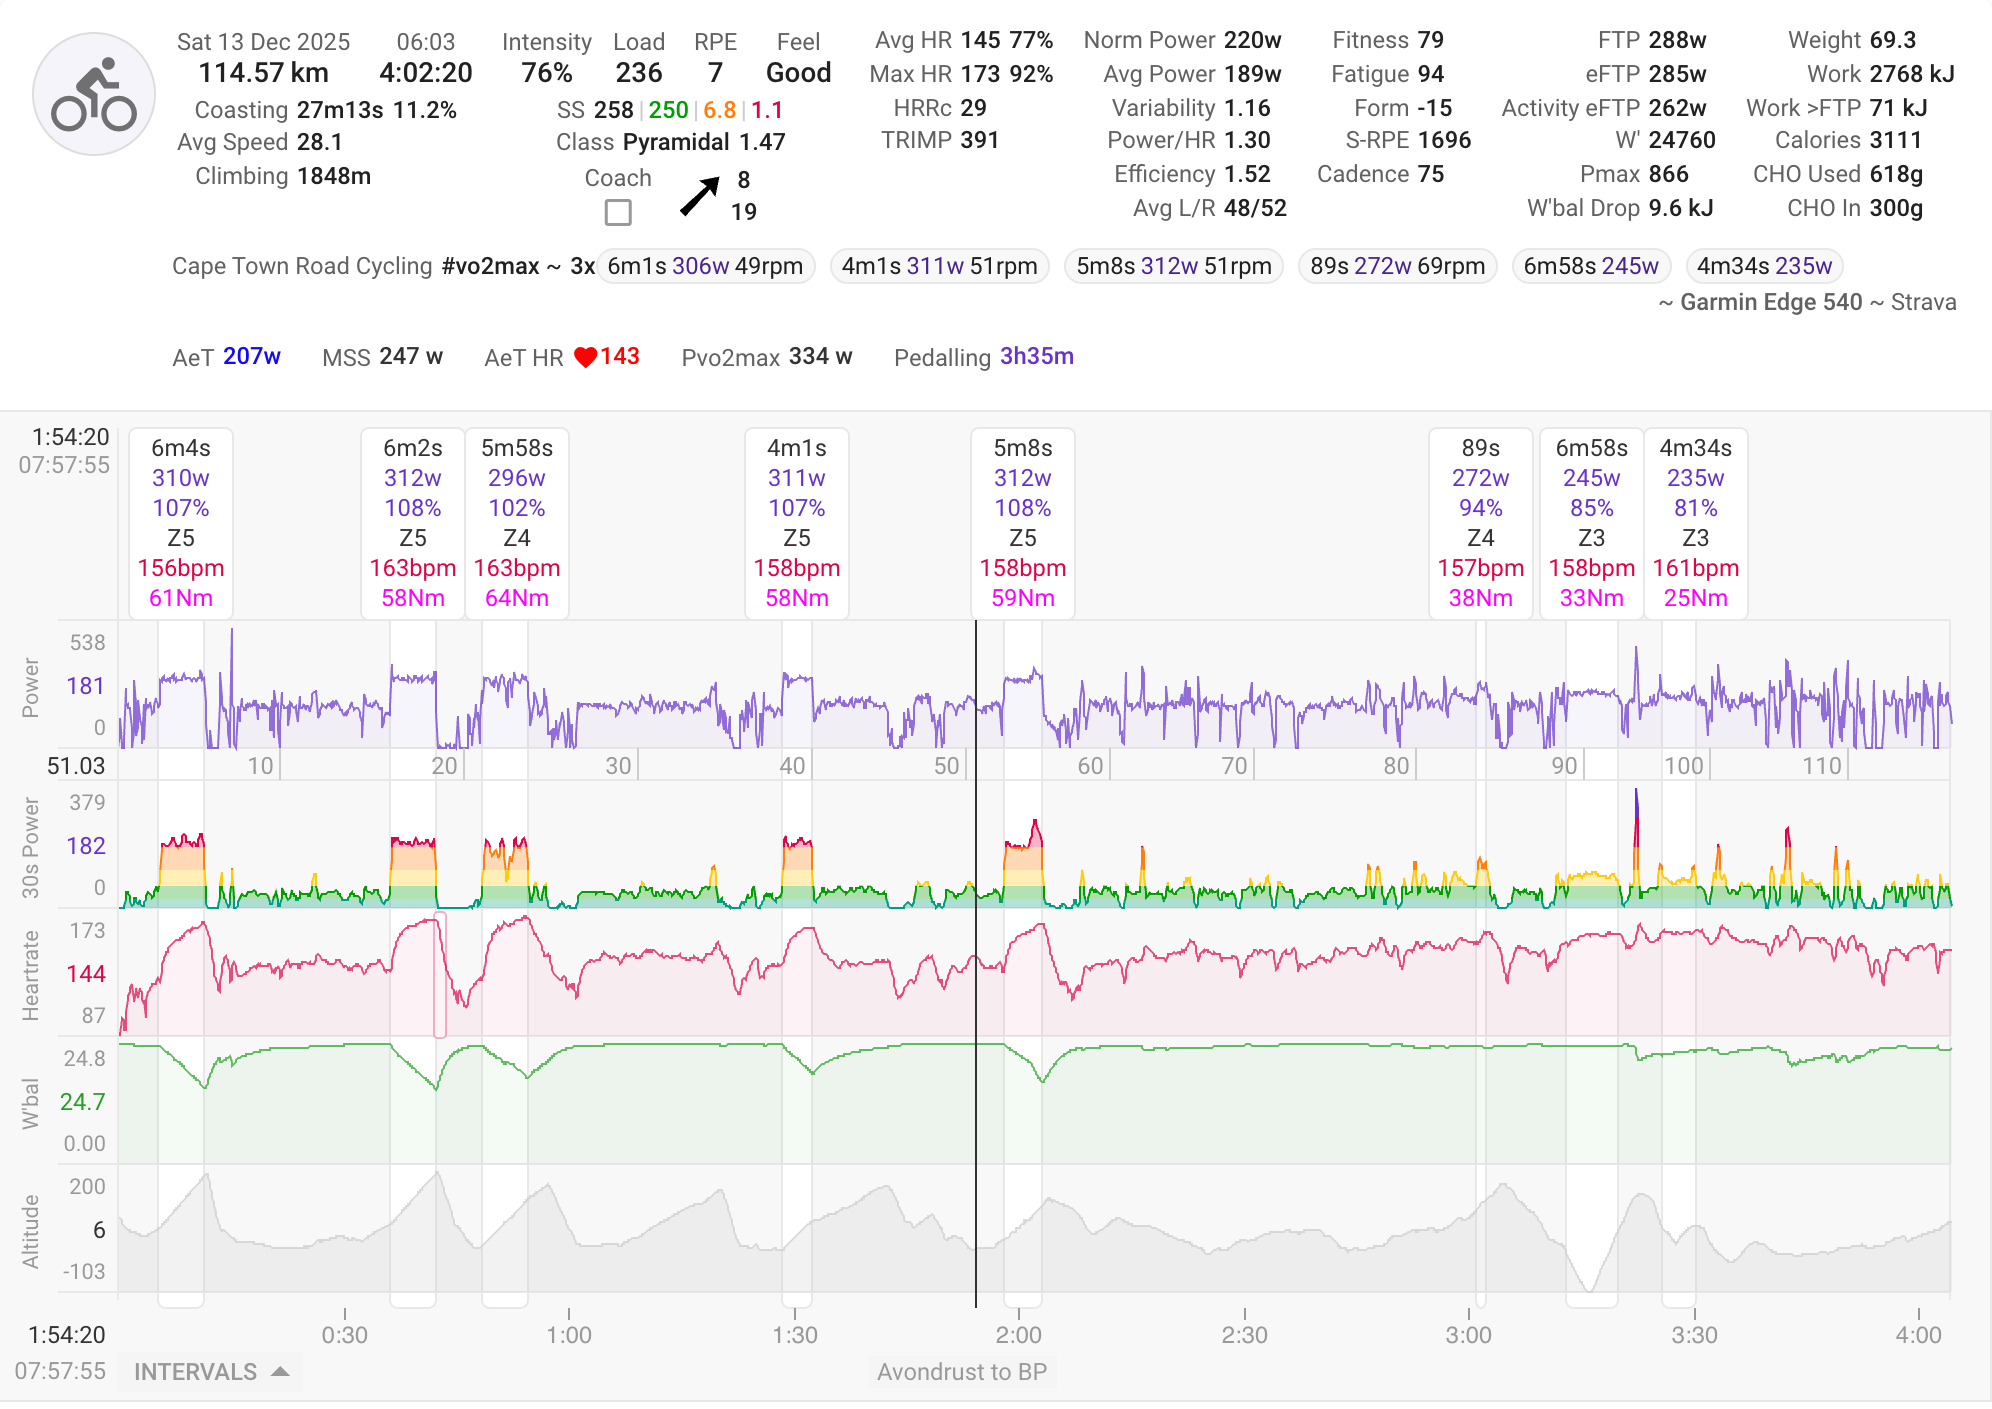
Activity Timeline
View your activity with Coggan metrics plus unique Intervals.icu metrics. Automatic interval detection finds your efforts, with spike detection and correction for power and HR data.
Learn more →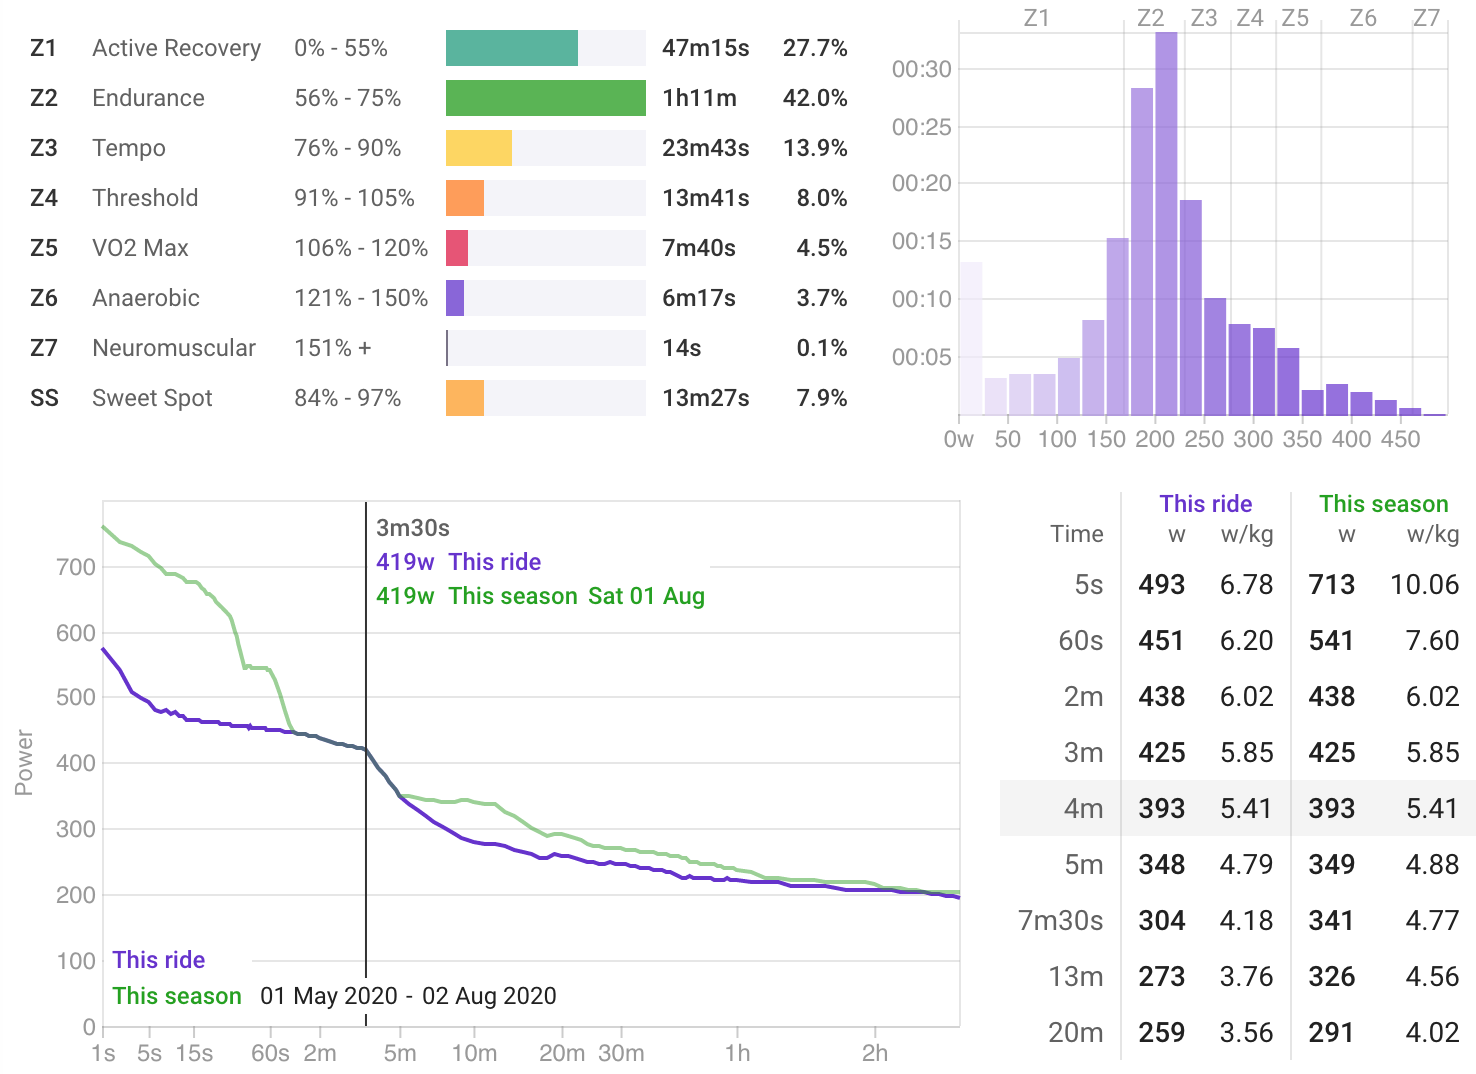
Power Charts
Analyze zone time distribution, view your 42-day power curve, histograms, and best efforts all within the context of a single activity.
Learn more →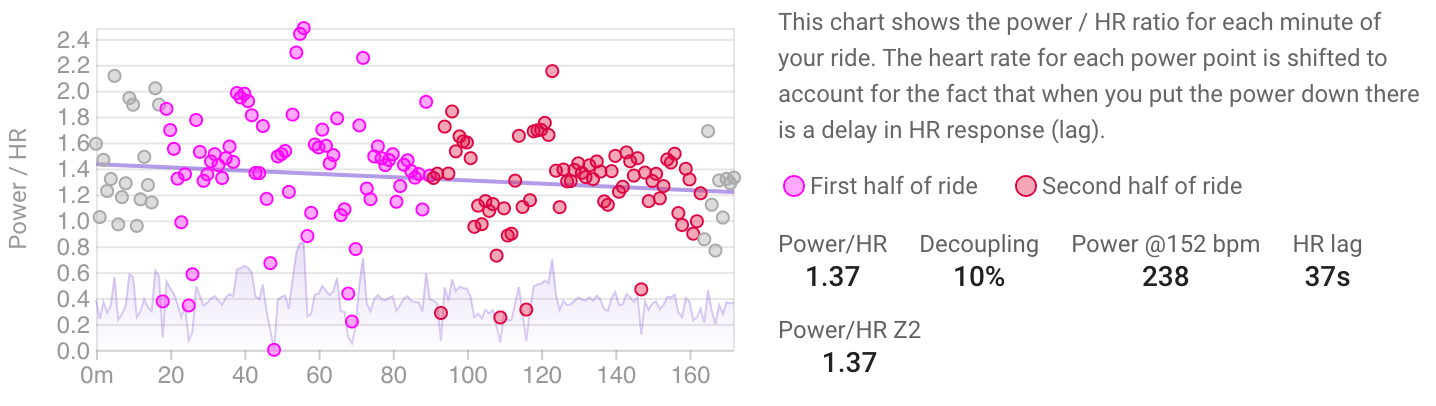
Decoupling
Track your aerobic fitness through cardiac drift analysis. The Power/HR Z2 metric provides a clear picture of your aerobic efficiency over time.
Learn more →